How To Integrate Particle and Losant
Particle and Losant are a powerful combination when it comes to building and delivering end-to-end IoT products and services. Particle provides hardware, secure device-to-cloud communication, and firmware over-the-air (FOTA) updates. Losant provides cloud data storage, visualizations, workflows, and the ability to deliver multi-tenant and branded experiences to your customers.
This guide provides step-by-step instructions for integrating Particle and Losant. In this guide, you’ll learn how to:
- Push data from Particle to Losant using Losant Webhooks.
- Use Losant Workflows to receive your Particle data and save that data to a Losant Device.
- Visualize your Particle data using Losant Dashboards.
Prerequisites
- Set up a Particle account, register a Particle device, and have knowledge of flashing a Particle device with firmware.
- Have a Losant account. If you do not have one, you can create a free sandbox account here.
For the purposes of this guide, the following firmware is used:
void setup() {


}

void loop() {

  // Generate random temperature and humidity values.
  int temp = random(20, 40);
  int humidity = random(20, 80);

  Particle.publish("telemetry_temp", String(temp));
  Particle.publish("telemetry_humidity", String(humidity));

  delay(120000);
}
This firmware generates random temperature and humidity values every two minutes and publishes those values to Particle.
Create the Losant Webhook
Note
Losant also provides a streaming integration for Particle. For the highest level of stability and performance, we recommend using webhooks instead of the integration.
If you do not already have a Losant Application, you can create one by clicking here. For this guide, we’re starting with a blank application.
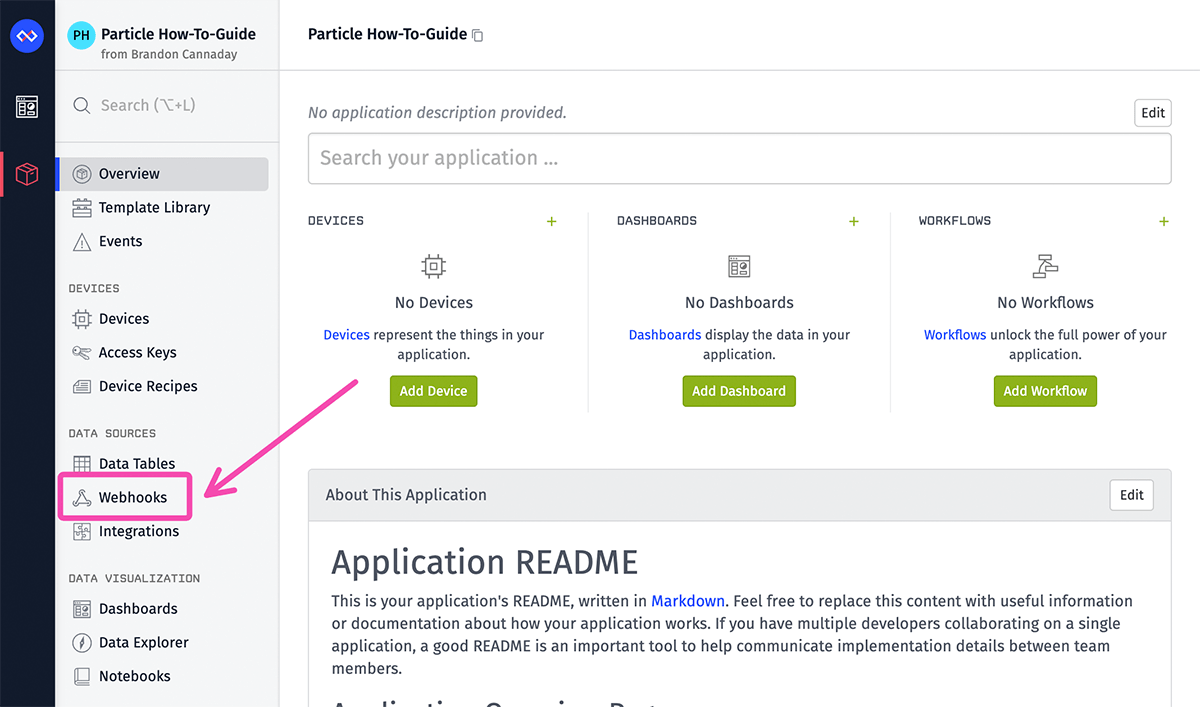
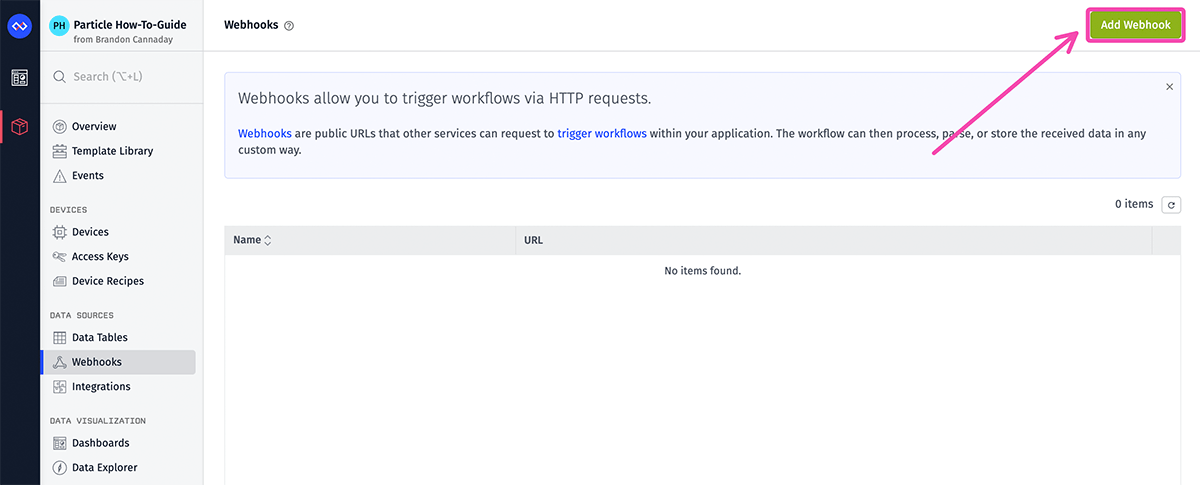
Once inside the application, click the Webhooks item in the left navigation and then click the Add Webhook button in the top right corner.
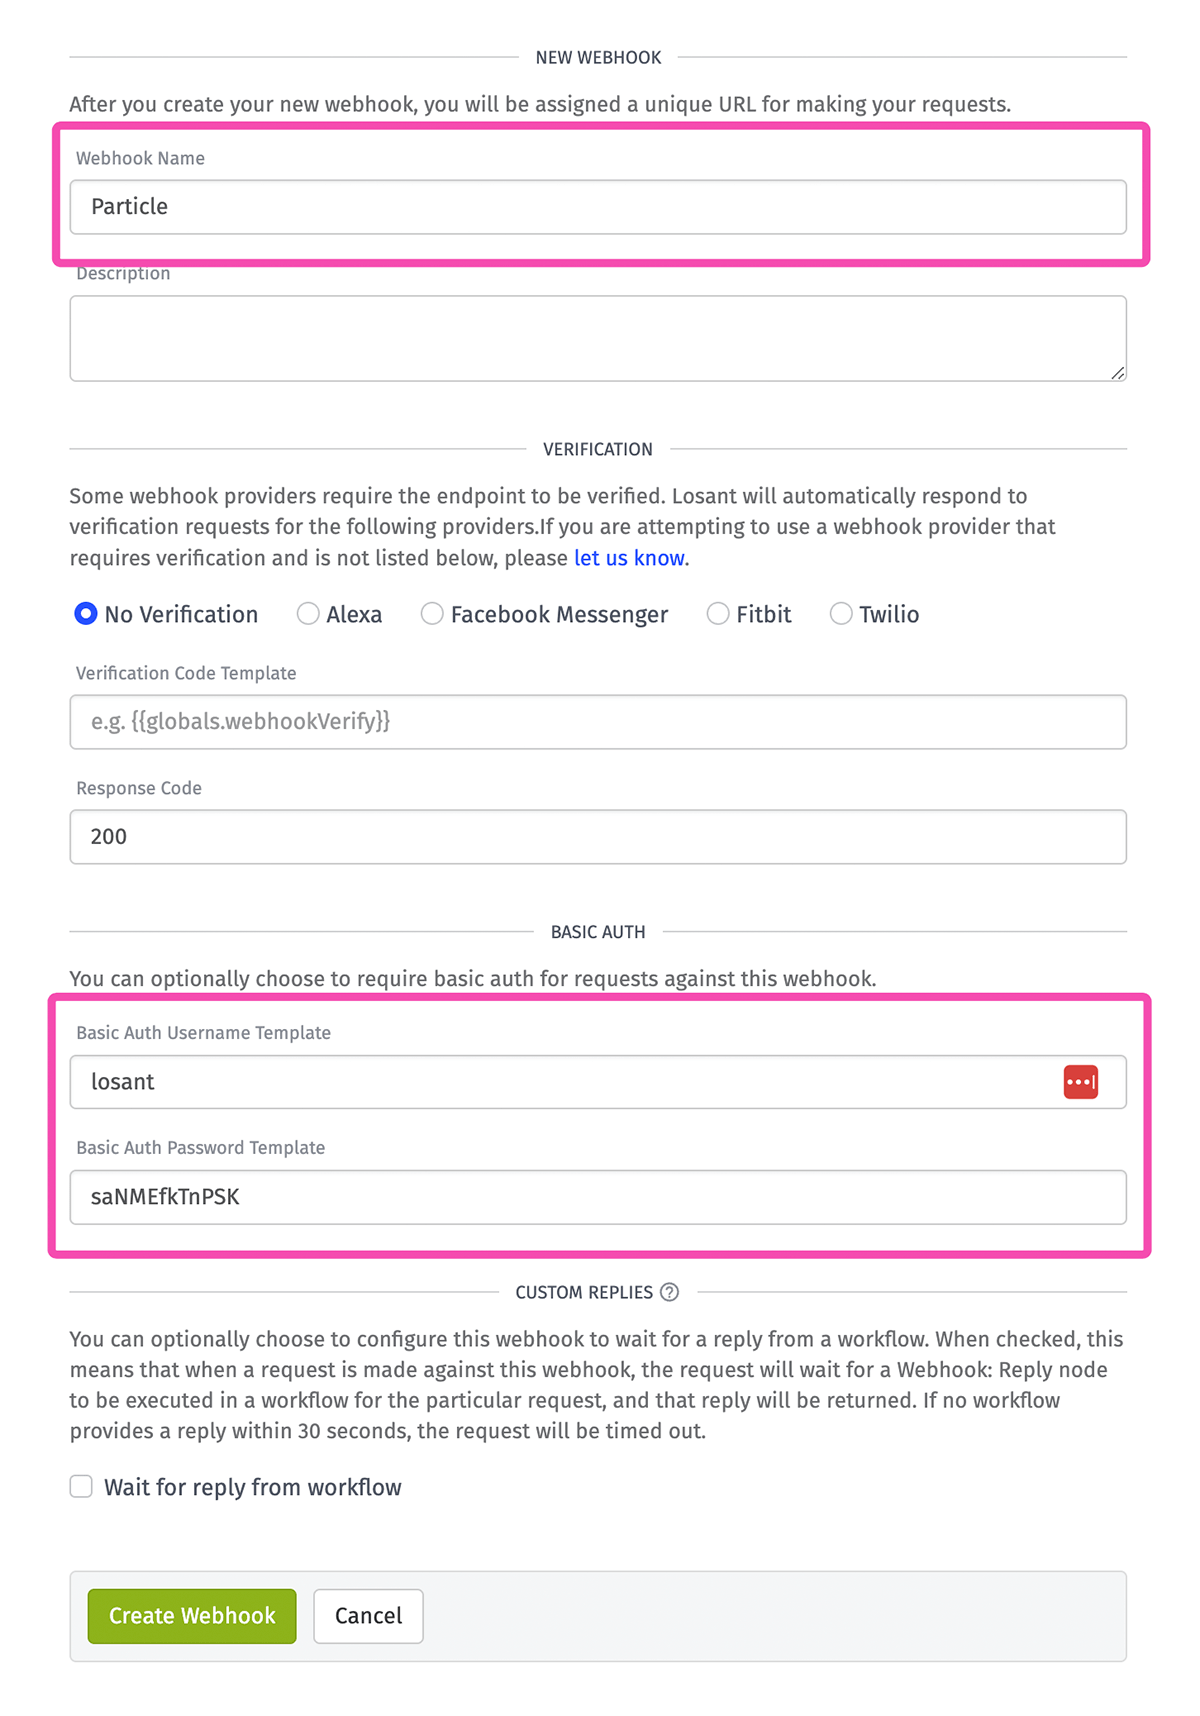
Name the webhook anything you’d like and provide a username and password in the Basic Auth section. We’ll be providing these credentials to Particle so it can securely invoke this webhook. Make sure to make the password strong and keep these credentials safe.
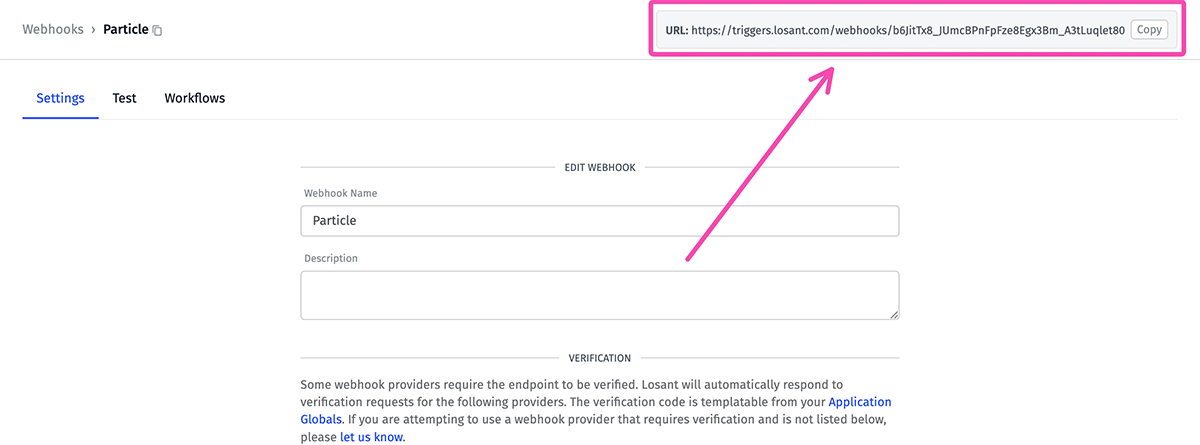
Click the Create Webhook button at the bottom. After the webhook has been created, you can copy your unique webhook URL from the top right corner of the page. You can also access this URL any time under your application’s list of webhooks.
Provide Particle the Webhook
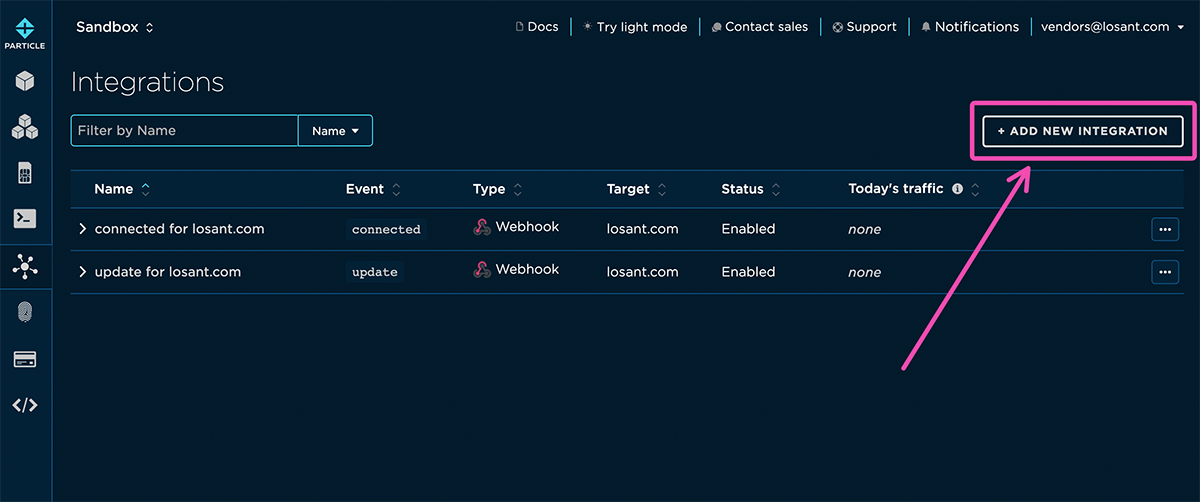
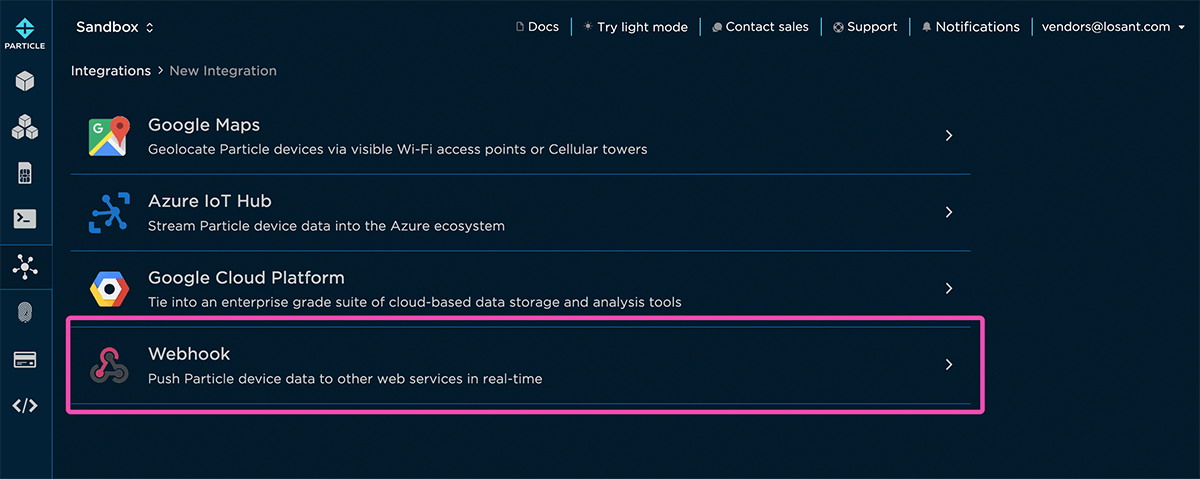
Inside the Particle console, navigate to Integrations and click the Add New Integration button. Next, select Webhook as the integration type.
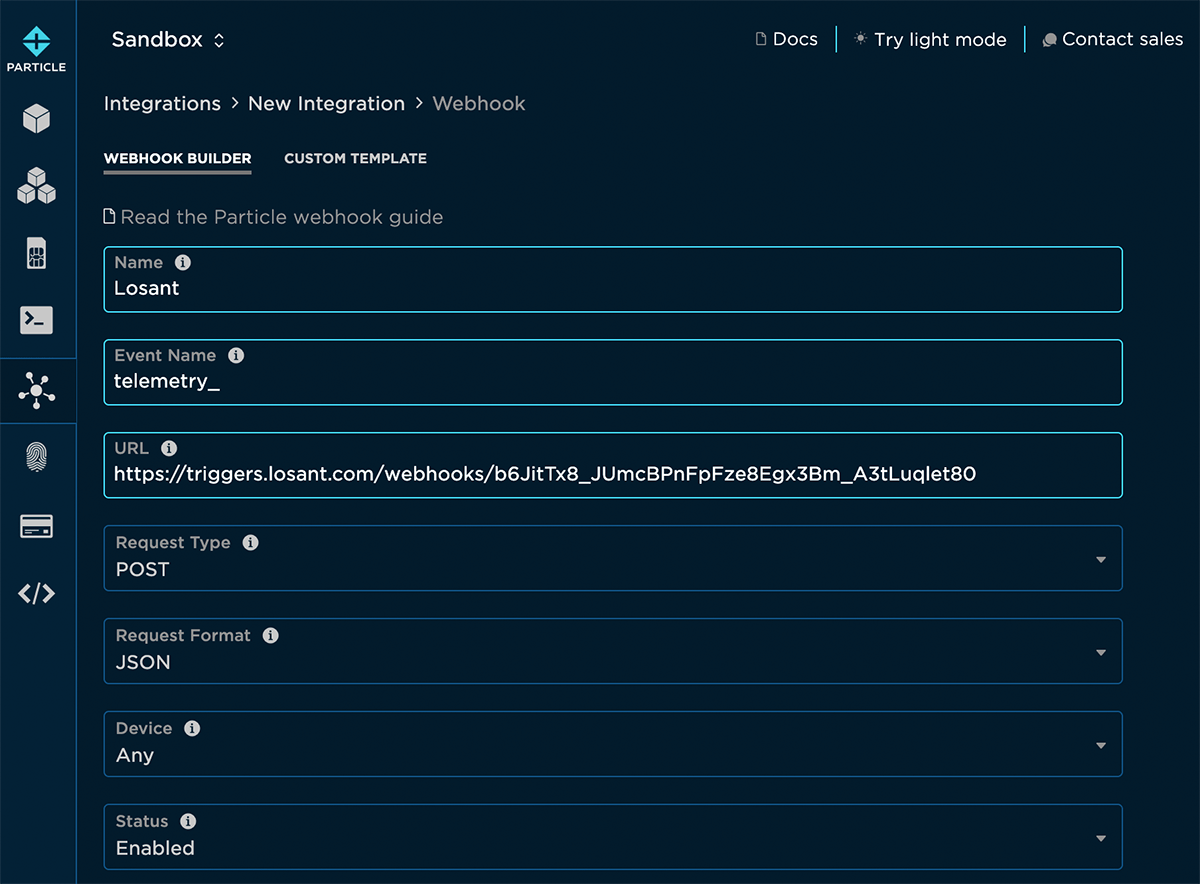
For this guide, the following configuration values are used:
- Event Name:
telemetry_- Any events that start with this prefix will be sent to the webhook. The firmware used in this guide publishes multiple events that start with this prefix (telemetry_temp,telemetry_humidity). With this configuration, we can use a single webhook to receive multiple data points. Based on your specific firmware and your specific event names, this value may be different. - URL:
https://triggers.losant.com/webhooks/YOUR_UNIQUE_ID- This is the webhook URL copy/pasted from the Losant portal. - Request Type:
POST- This is the default setting. - Request Format:
JSON- This controls how the data will be formatted when it’s provided to the webhook. For Losant, JSON is the best option since the workflow engine will automatically parse the data into an object. - Device:
Any- This guide provides an implementation that supports any number of devices reporting the same events.
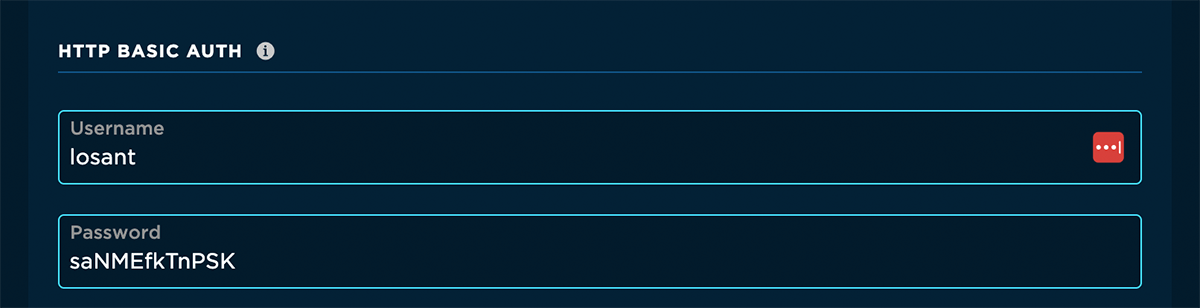
Under the Advanced Settings, we need to provide Particle with the basic auth username and password that we configured for this webhook.
Last, click the Create Webhook button. At this point, Particle will begin invoking the webhook whenever one of your devices publishes an event that starts with telemetry_. We now need to return to Losant to receive, parse, and store this event data.
Create the Losant Device
All time-series telemetry data in Losant is stored on Device Attributes. This means that we need to create a Losant device to represent each of your Particle devices. For the purposes of this guide, we’ll create the device manually. In large-scale production applications, it’s common to use Device Recipes for bulk or on-demand device creation.
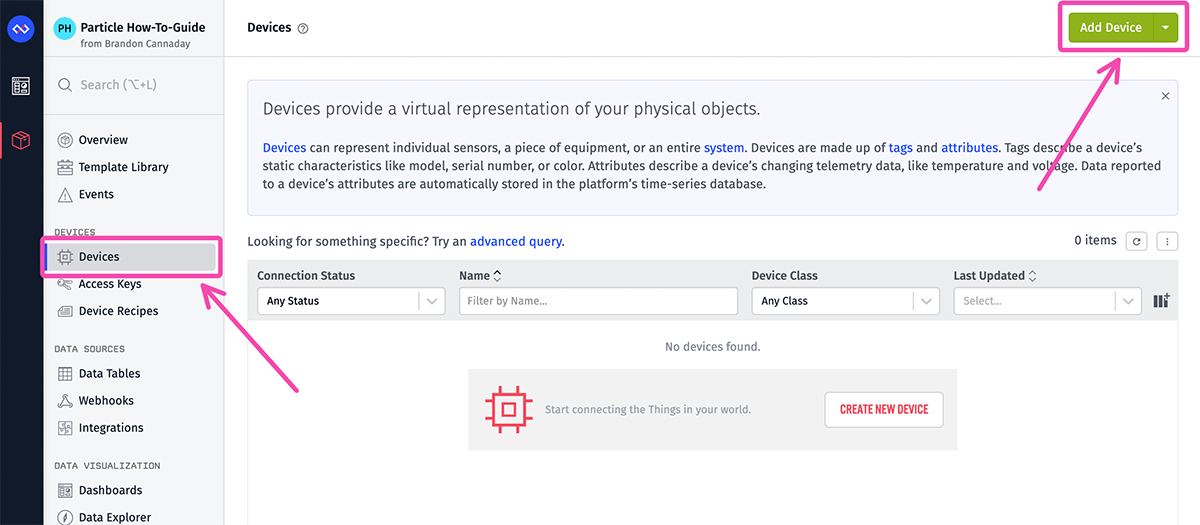
In your Losant application, click the Devices left navigation item and then click the Add Device button in the top right corner.
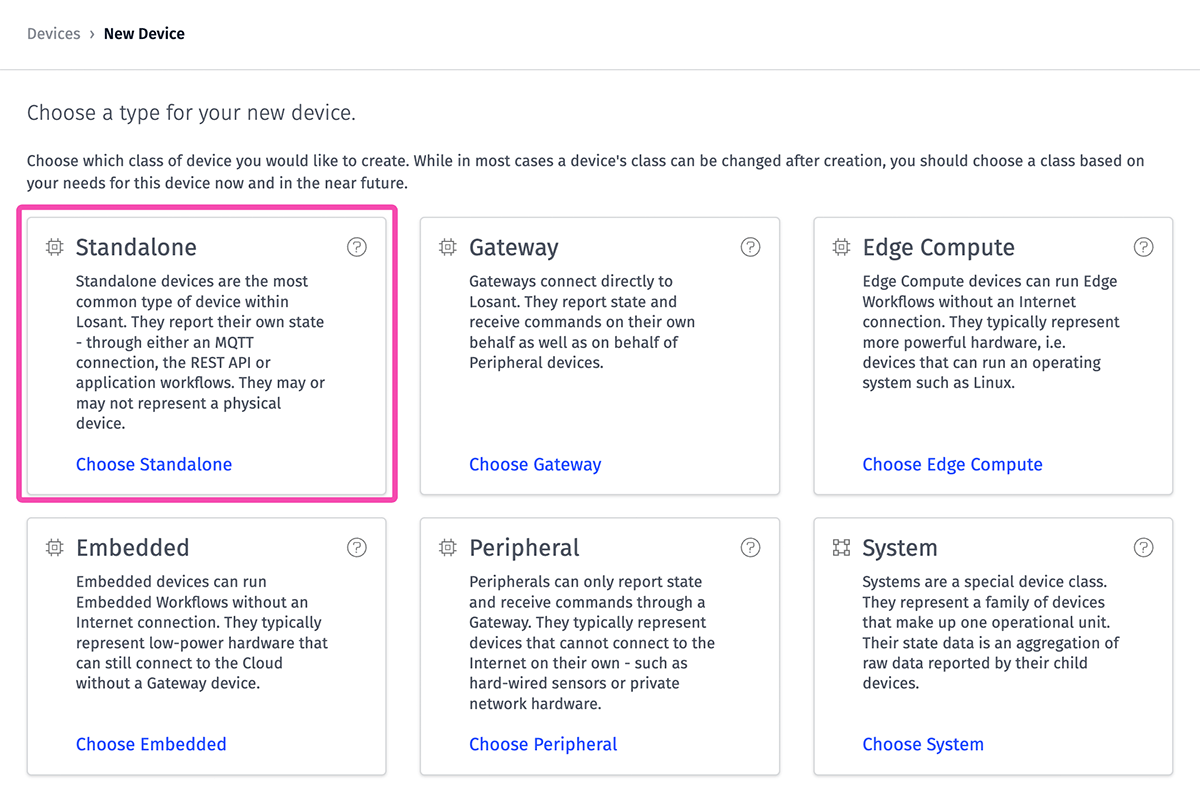
On the next screen, choose Standalone as the device type.
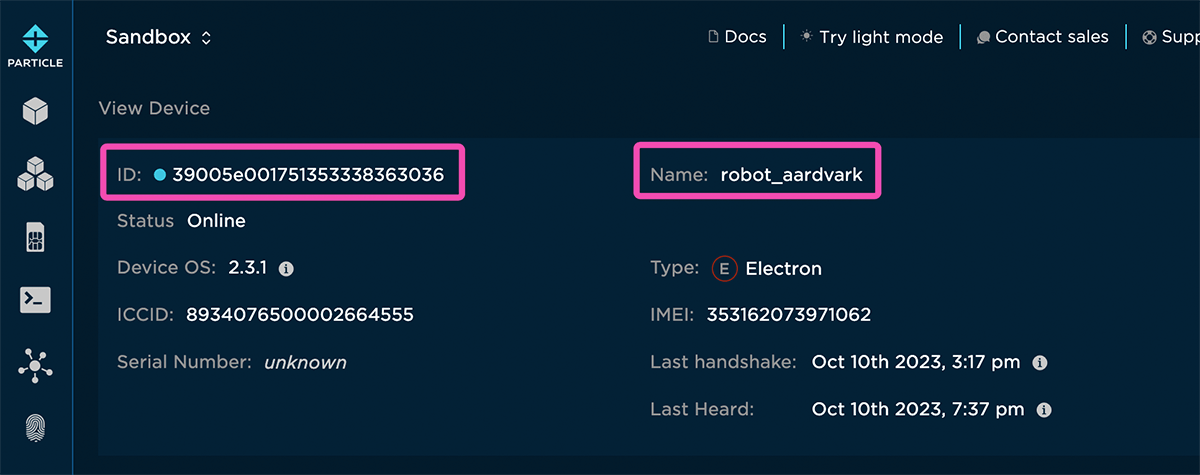
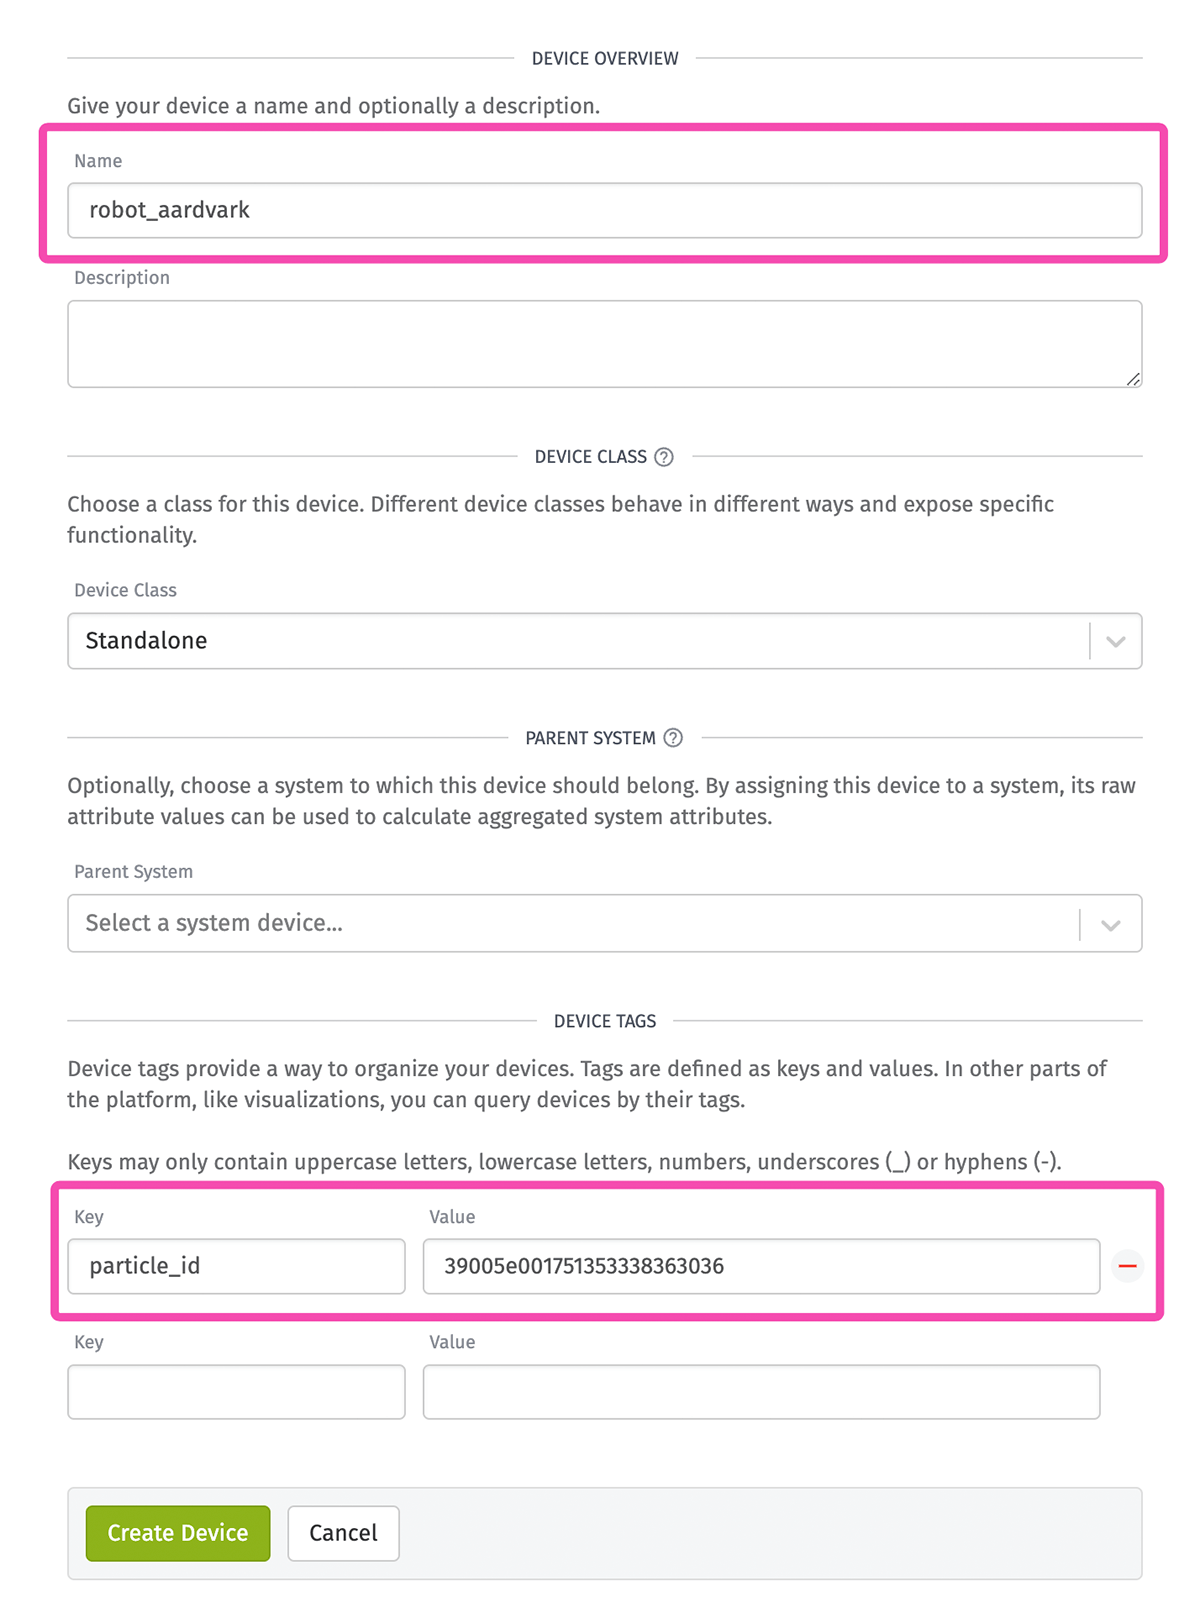
For this guide, the device’s name is set to the same name found in the Particle console, however the name can be anything you’d like. The most important step is to define a particle_id device tag and set it to the ID of your Particle device. This provides a way to map incoming webhook data to the correct device.
Click the Create Device button. After the device is created, you’ll be placed on the new device’s “Attributes” tab. This guide is reporting telemetry values for temperature and humidity. Therefore, we need to create two attributes on the device: One named temp and one named humidity. Both attribute types are Number. These names match the Particle event names with the telemetry_ prefix removed.

Click the Update Attributes button to complete the device.
Build the Losant Workflow
All logic in Losant is done using drag-and-drop Workflows. In this case, we need to trigger a workflow whenever data is received over our webhook, parse that data, and save it to the correct device.
To create a workflow, click the Workflows left navigation item and then click the Add Workflow button in the top right corner.
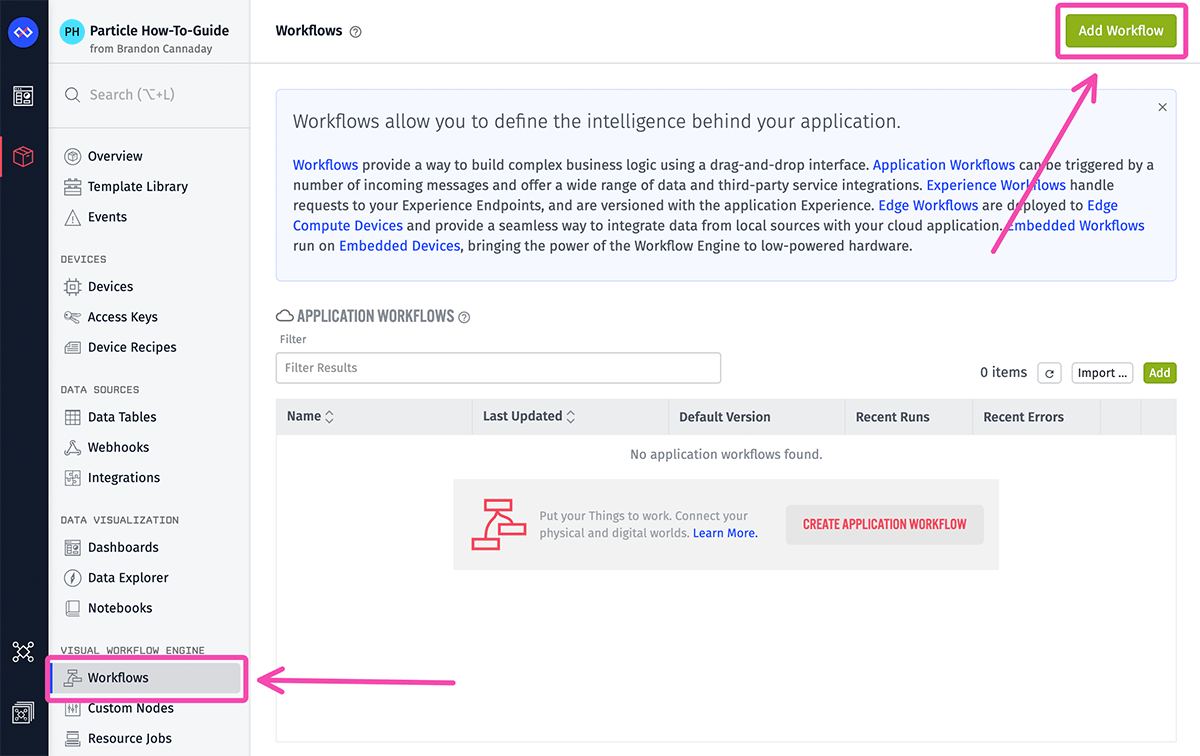
You can name the workflow anything you’d like and set the Workflow Type to Application. Losant supports multiple types of workflows depending on the specific logic you’re building. Application Workflows run in the cloud and are used for general purpose processing and data handling.
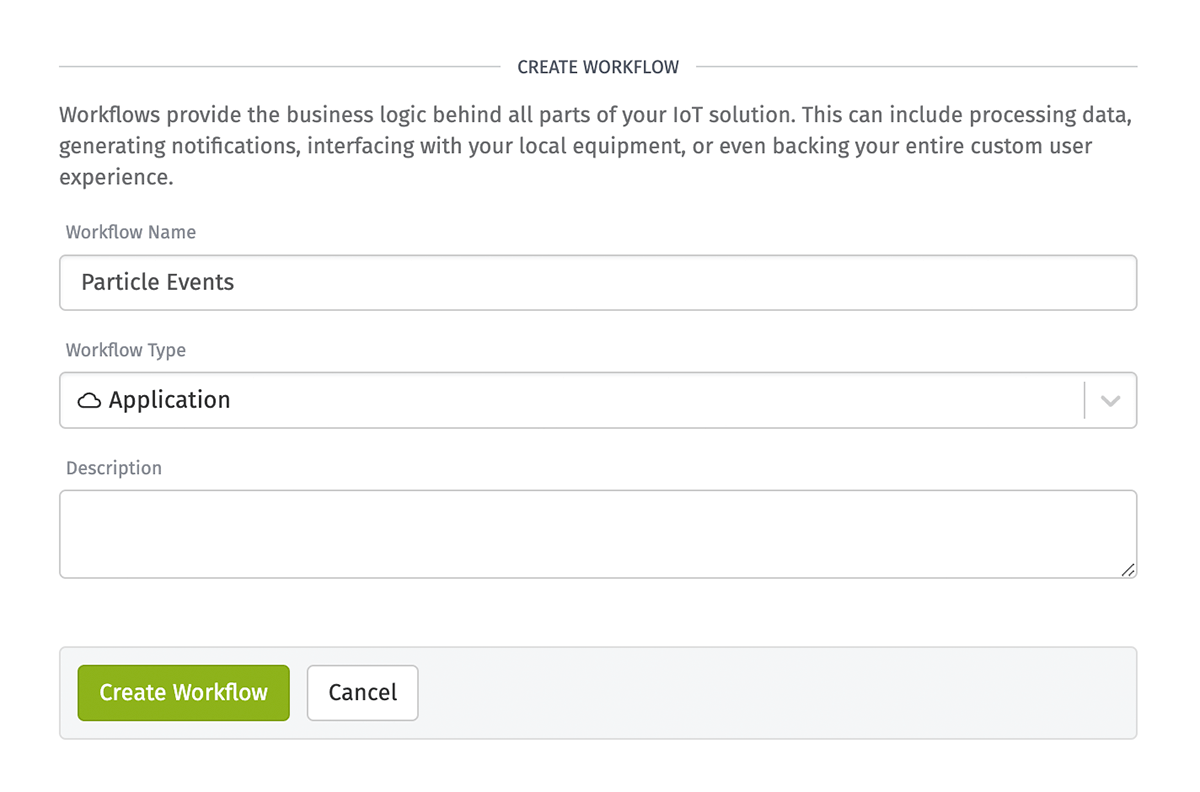
After clicking Create Workflow, you’ll be taken to the workflow canvas where we can begin building.
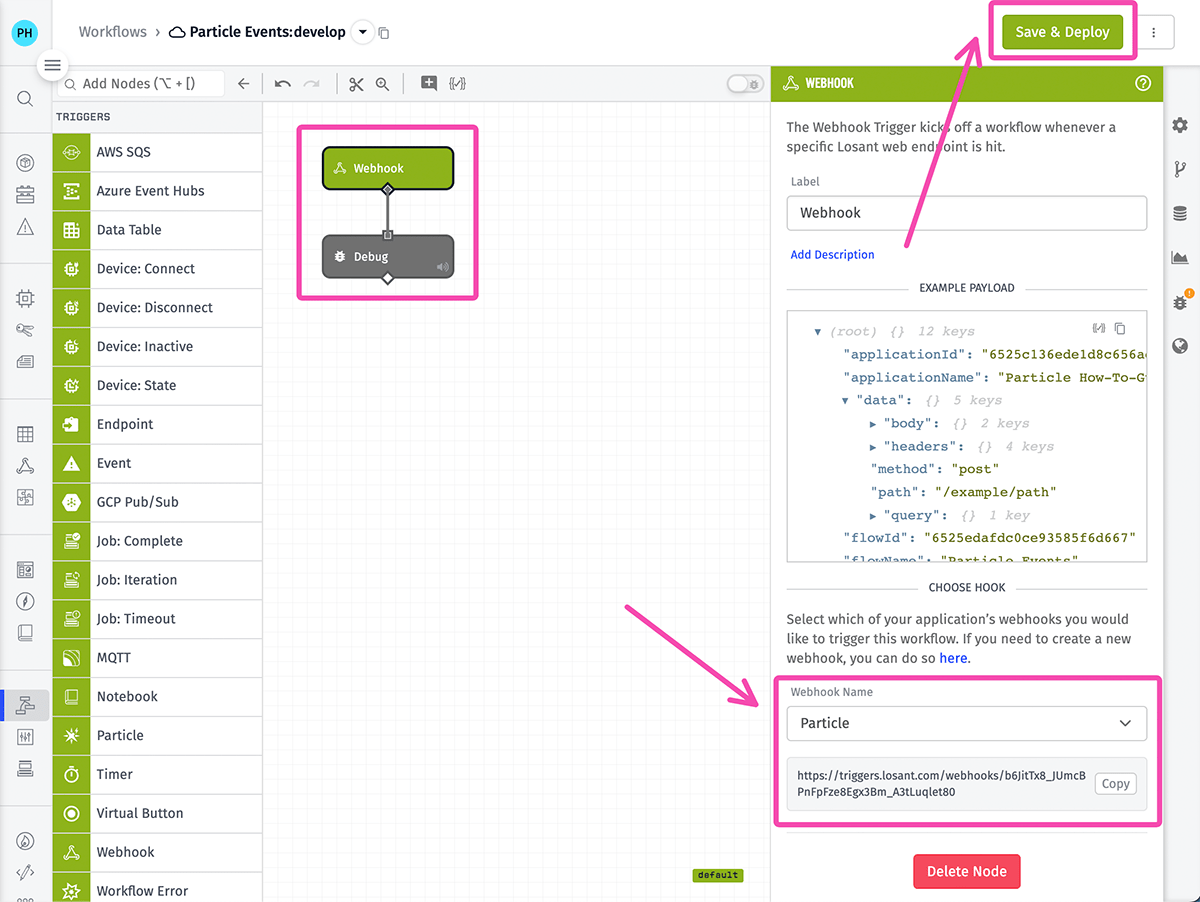
The first thing we need to do is see if data is being received. Start by adding a Webhook Trigger and a Debug Node to the canvas and connecting them together. If your application has multiple webhooks, make sure you select the correct webhook in the trigger’s configuration.
Once complete, click the Save & Deploy button to publish this workflow.
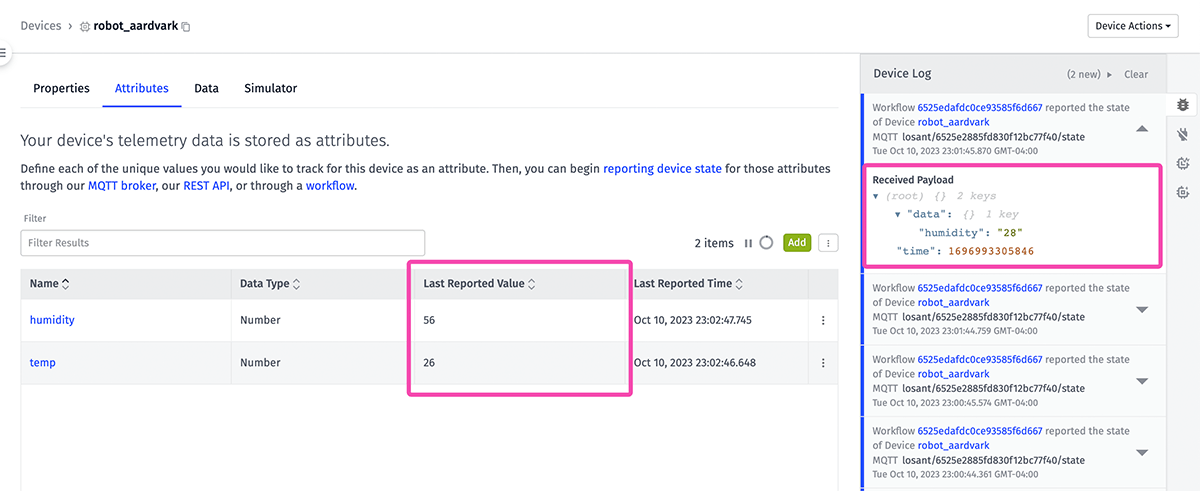
The firmware used in this guide is publishing events every two minutes. After waiting a moment, you should see a message in the Debug Panel with the payload received over the webhook.
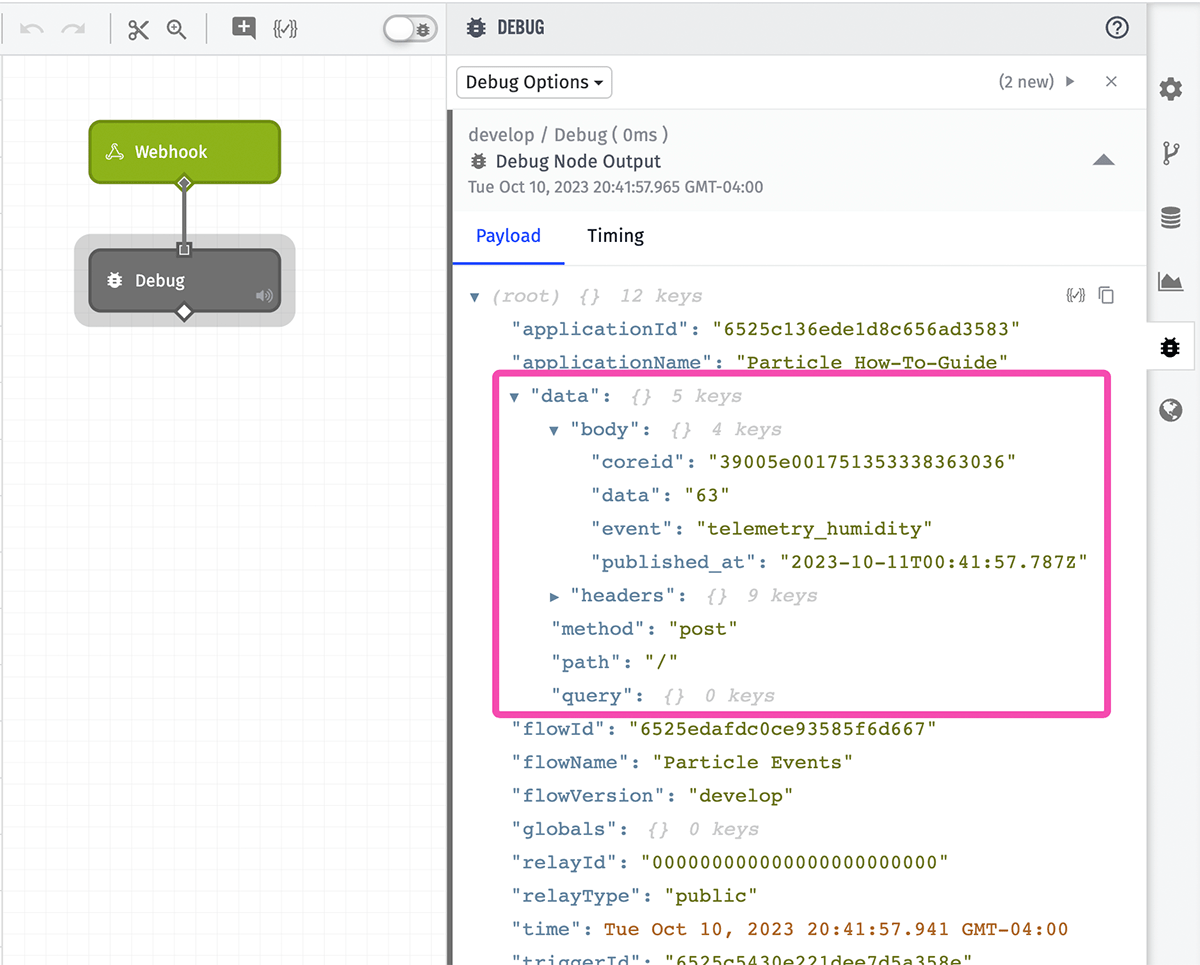
In the received payload, we have everything required to identify the correct device, identify the correct attribute, and store the value.
data.body.coreid: The ID of the device as it is registered in Particle.data.body.event: The name of the Particle event that was published.data.body.data: The value that was published for the event.
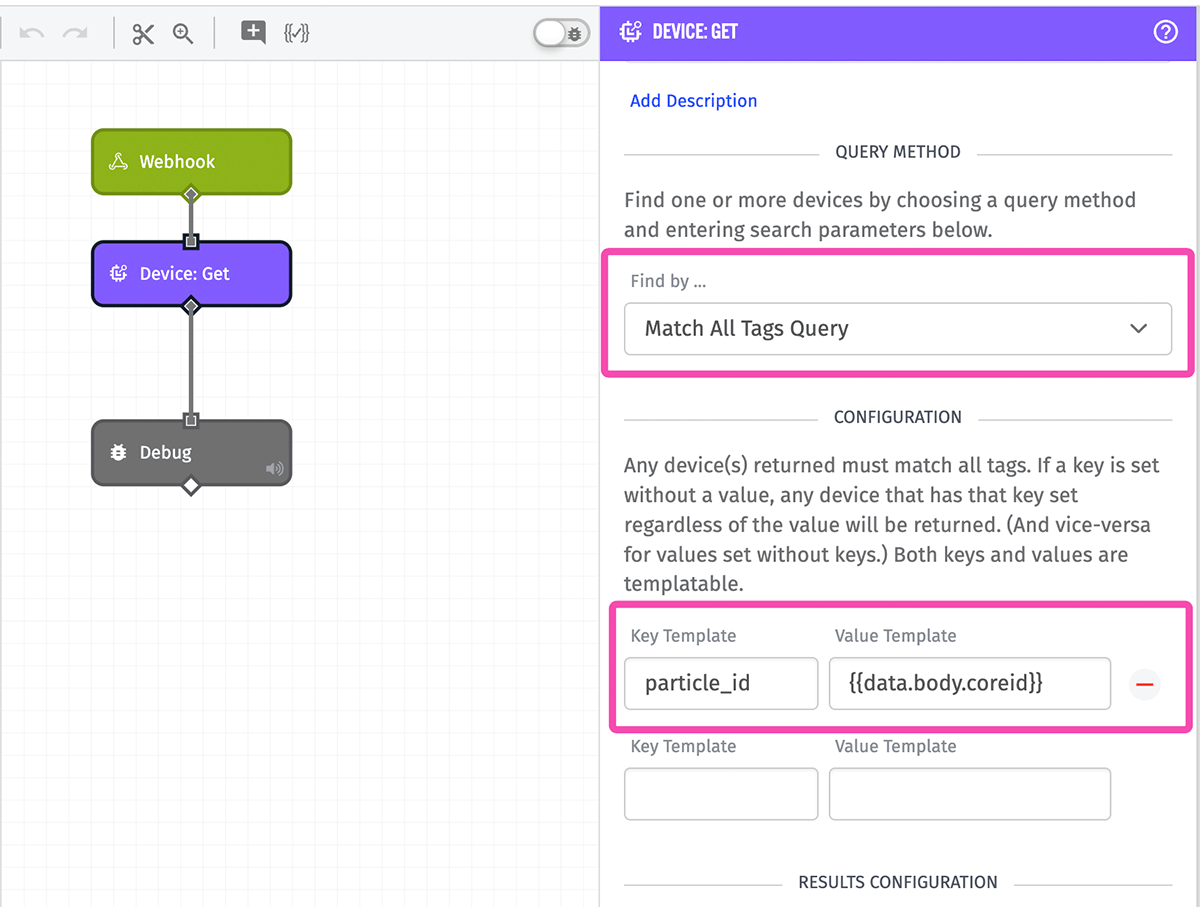
When we created our Losant device, we added the particle_id tag, which can be used to find the Losant device that matches the incoming coreid. Add a Device: Get Node to the workflow to do this lookup.
- Set the Query Method to Find All Tags Query.
- Add the
particle_idtag and specify the value as the template{{data.body.coreid}}, which is a string template referencing a value on your payload found at the dot-notation path ofdata.body.coreid. - Set the Result Path to
working.device, which is a payload path for where to store the result of this node’s execution.
Click Save & Deploy again to publish this updated workflow. After a moment, you should see another debug message with the device added to the payload at working.device.
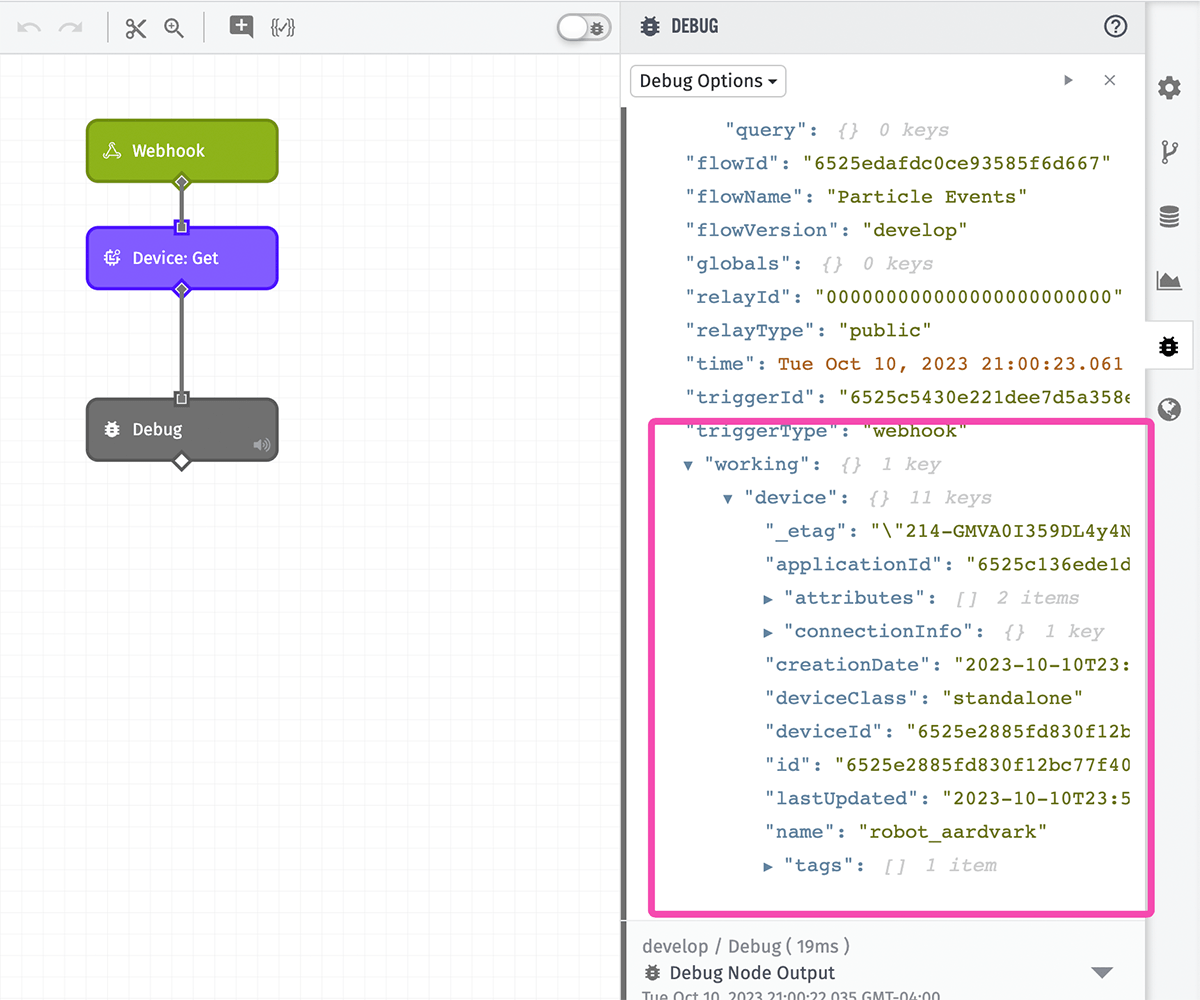
There’s nothing special about the working payload path. You can choose to put data anywhere you’d like on the payload. We’ve adopted working as a best practice.
The result of the Device: Get Node could be null if a matching device wasn’t found. We now need to branch the workflow using a Conditional Node and only continue if we actually found a device.
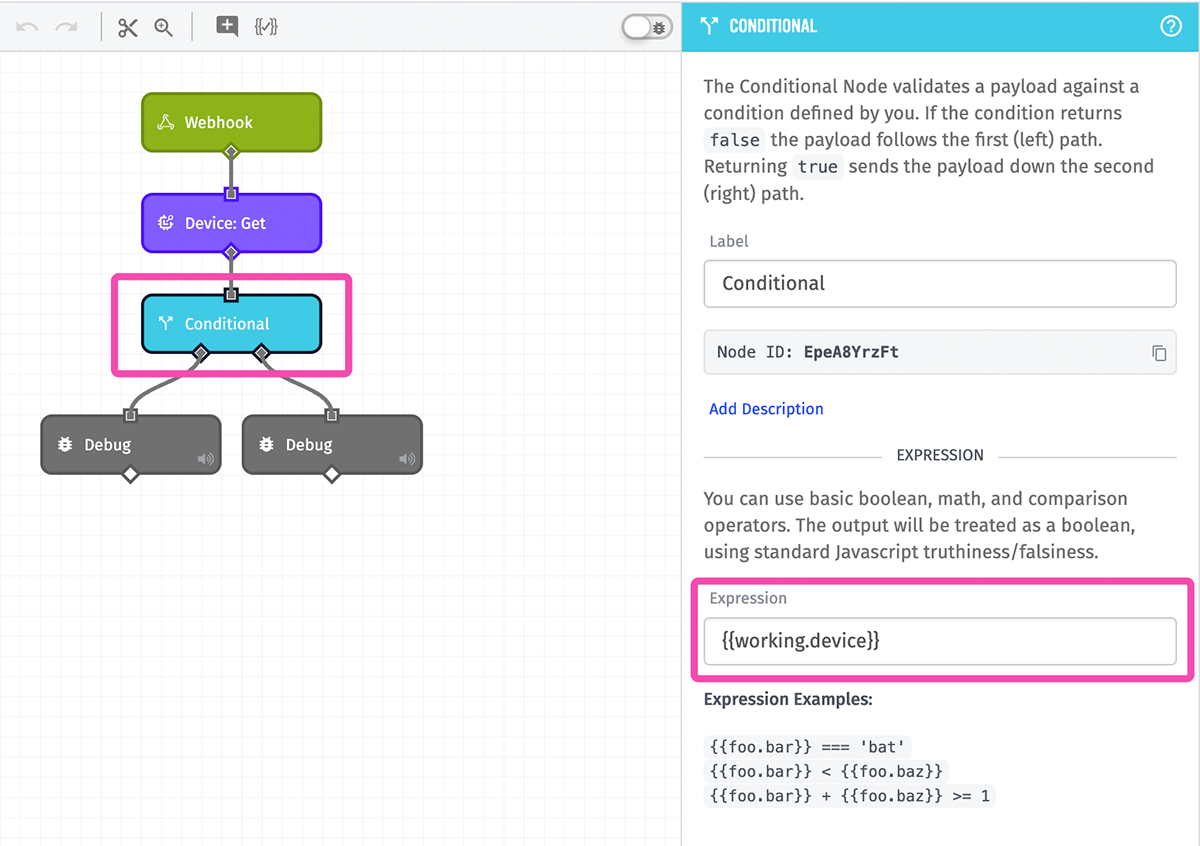
The Conditional Node takes an expression that will evaluate to either true or false. If the result is true, the workflow will take the right path. If the result is false, the workflow will take the left path. The expression we’re using is:
This expression is checking that the value at working.device is something truthy. If a device was not found, this value will be null, which evaluates to false. For this guide, if the device was not found, the workflow simply ends in a Debug Node. In many production applications, this is where on-demand device creation is performed using the Device: Create Node.
Now that we have a device, the next step is to find the attribute on which to record the incoming value. We named the device attributes temp and humidity, which match the Particle event names with telemetry_ removed. Therefore, we can split the incoming event name by underscore (_) and the attribute name will be at the second index. This can be done by adding a String Node and using the Split operation.
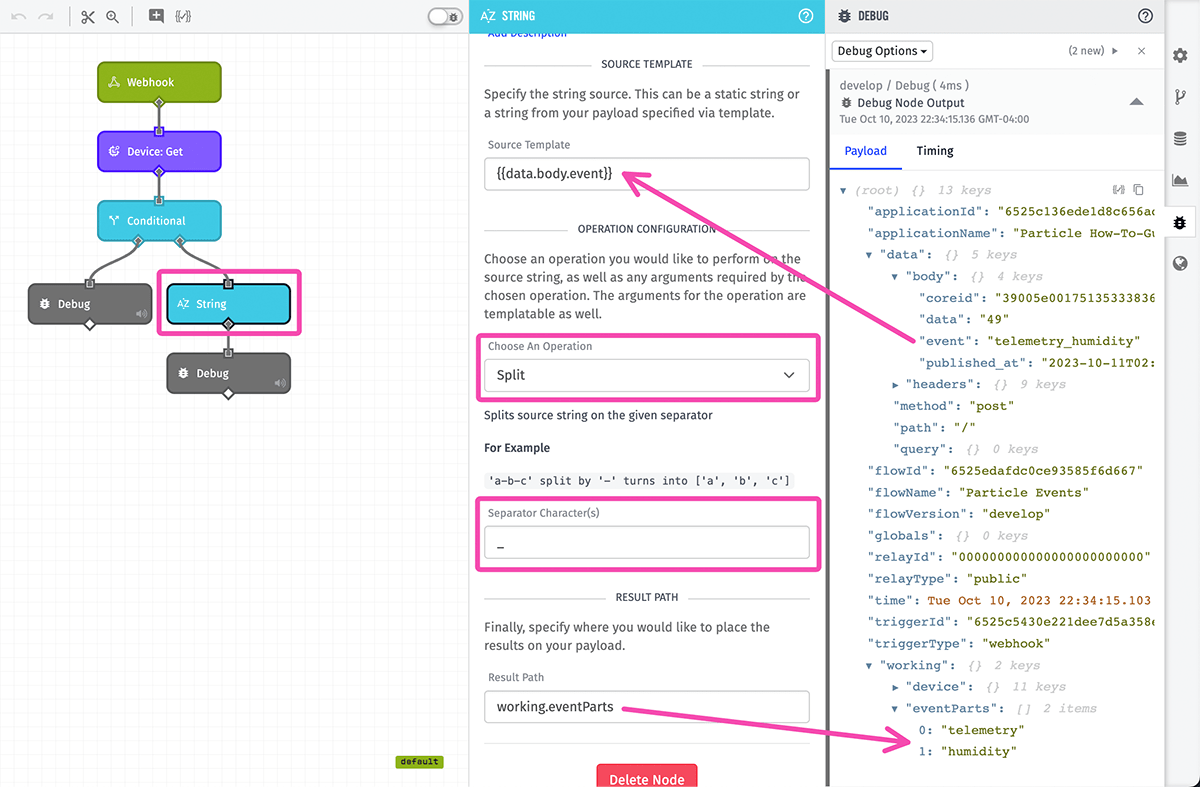
As you can see in the screenshot above, we’re splitting the string at data.body.event on the underscore character and putting the result back on the payload at working.eventParts. The result at working.eventParts is an array where the first index is telemetry and the second index is the name of the attribute (temp or humidity).
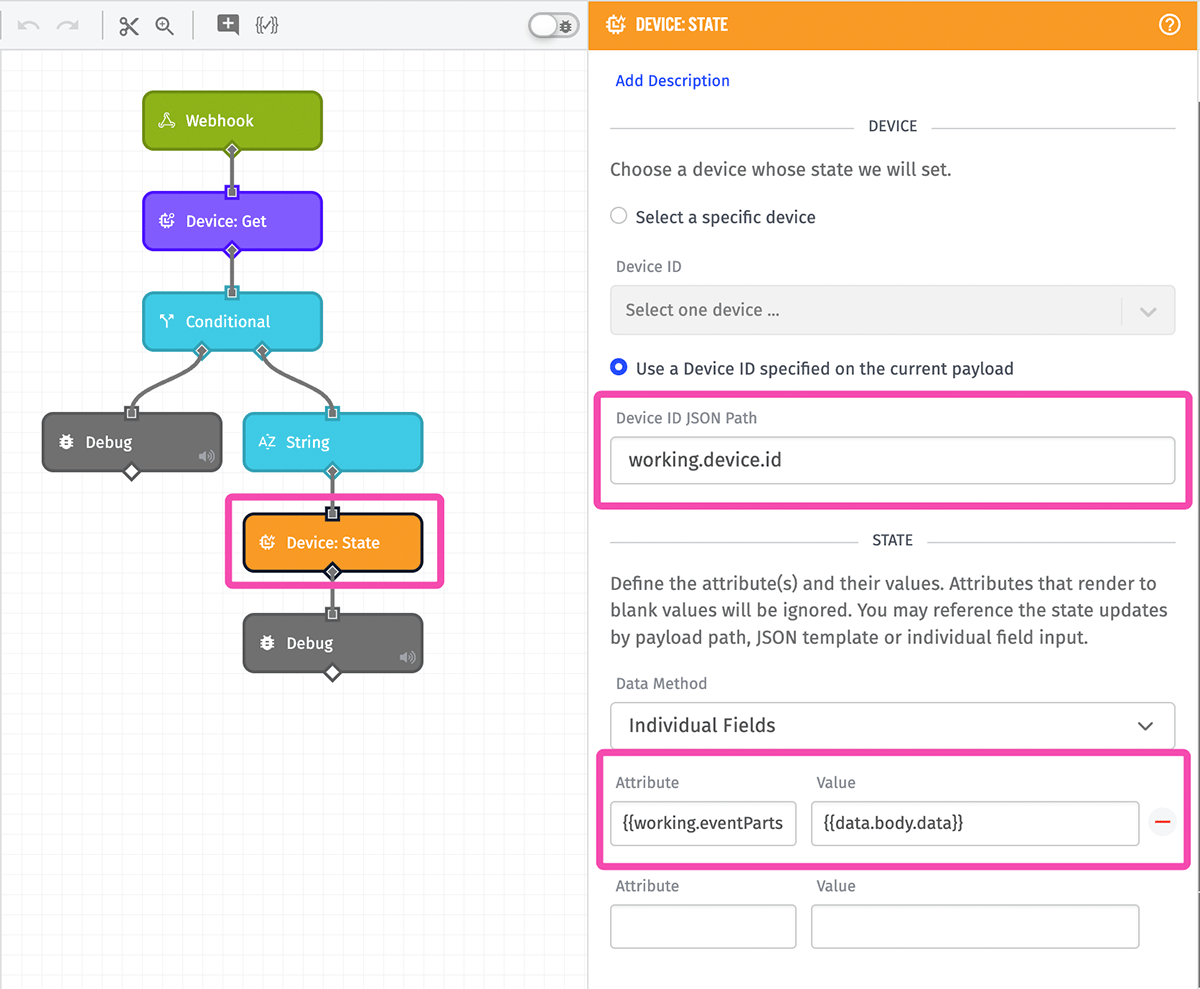
We now have everything we need to record the incoming value. This is done by adding a Device: State Node. In Losant, telemetry data stored on device attributes is called ”device state”. The Device: State Node has the following configuration:
- Device ID JSON Path:
working.device.id- This is the Losant ID (not the Particlecoreid) of the Losant device we found using the Device: Get Node. - Attribute:
{{working.eventParts.[1]}}- This string template is accessing the second index in the array this holds the result of the string split operation. - Value:
{{data.body.data}}- This is the incoming value provided by Particle.
You may notice that some configuration fields use double curly braces while others don’t. The difference is whether the field is a template field or a payload path field. Most fields are template fields, which use double curly braces to reference values on the payload. Templates are very powerful and allow you to modify values or combine values together. Payload path fields are only asking for the location of a value on the payload, so curly braces are not used.
Click Save & Deploy to publish the completed workflow. You can now return to the device’s “Attributes” tab and see that state data is successfully being recorded.
Visualize Your Particle Device Data
Now that data is being recorded to device attributes, we can create a Dashboard to view the real-time and historical telemetry data.
To create a dashboard, click the Dashboards left navigation item and then click the Add Dashboard button in the top right corner.
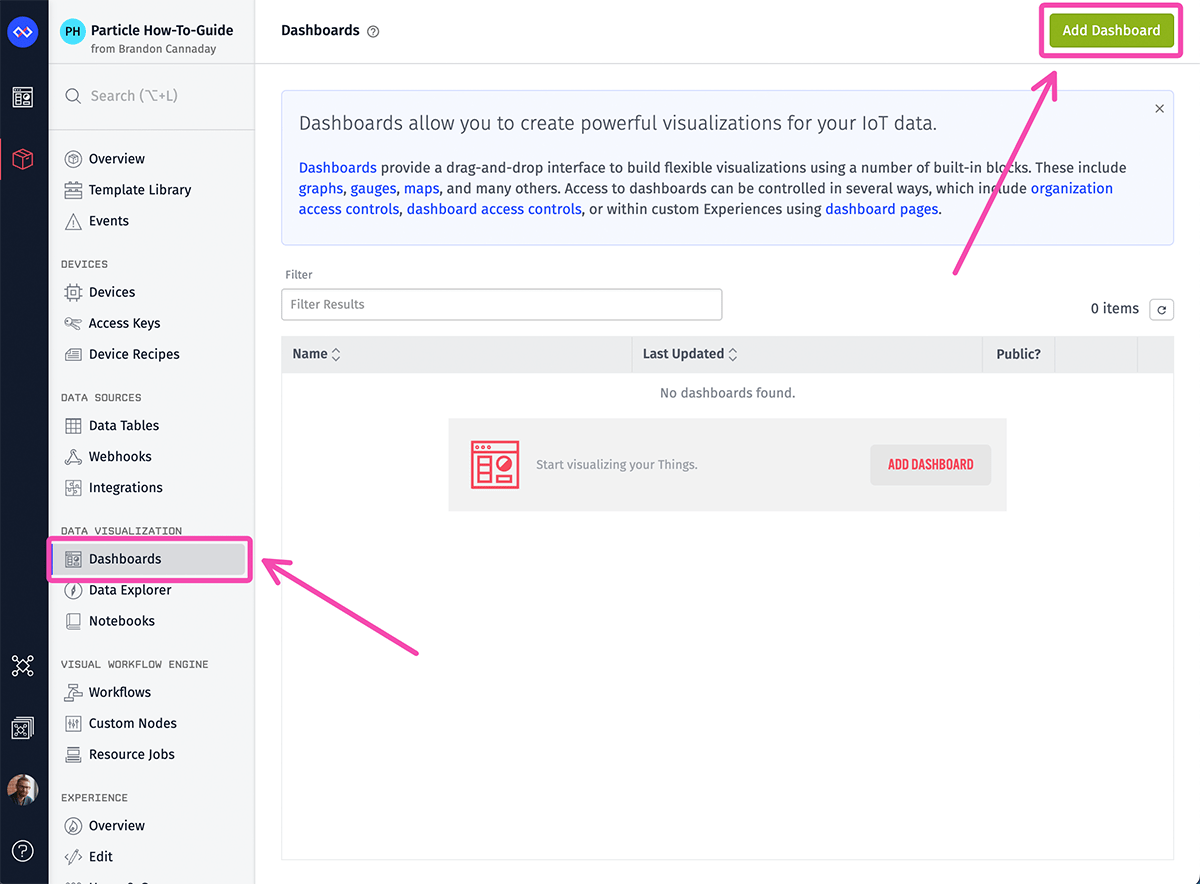
You can name the dashboard anything you’d like. Once the dashboard is created, click one of the Add Block buttons to add your first dashboard block.
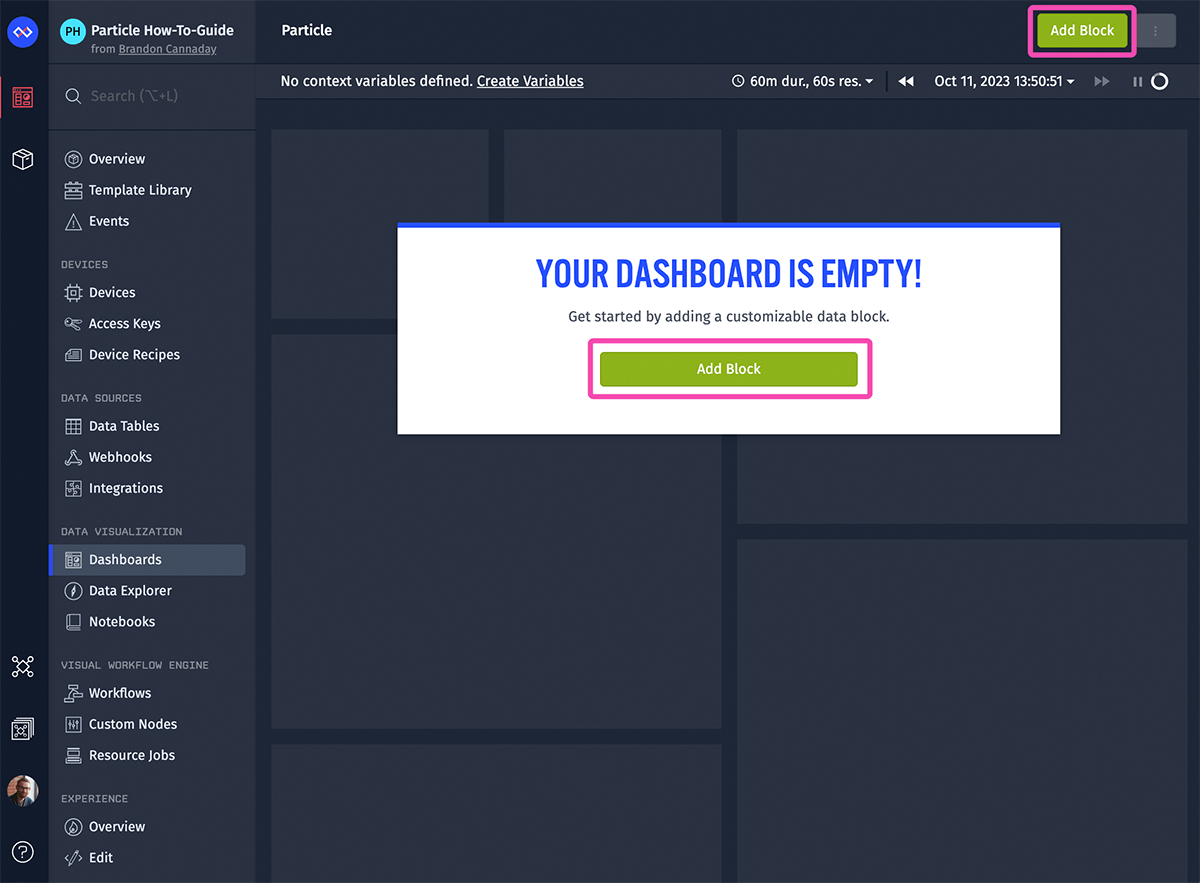
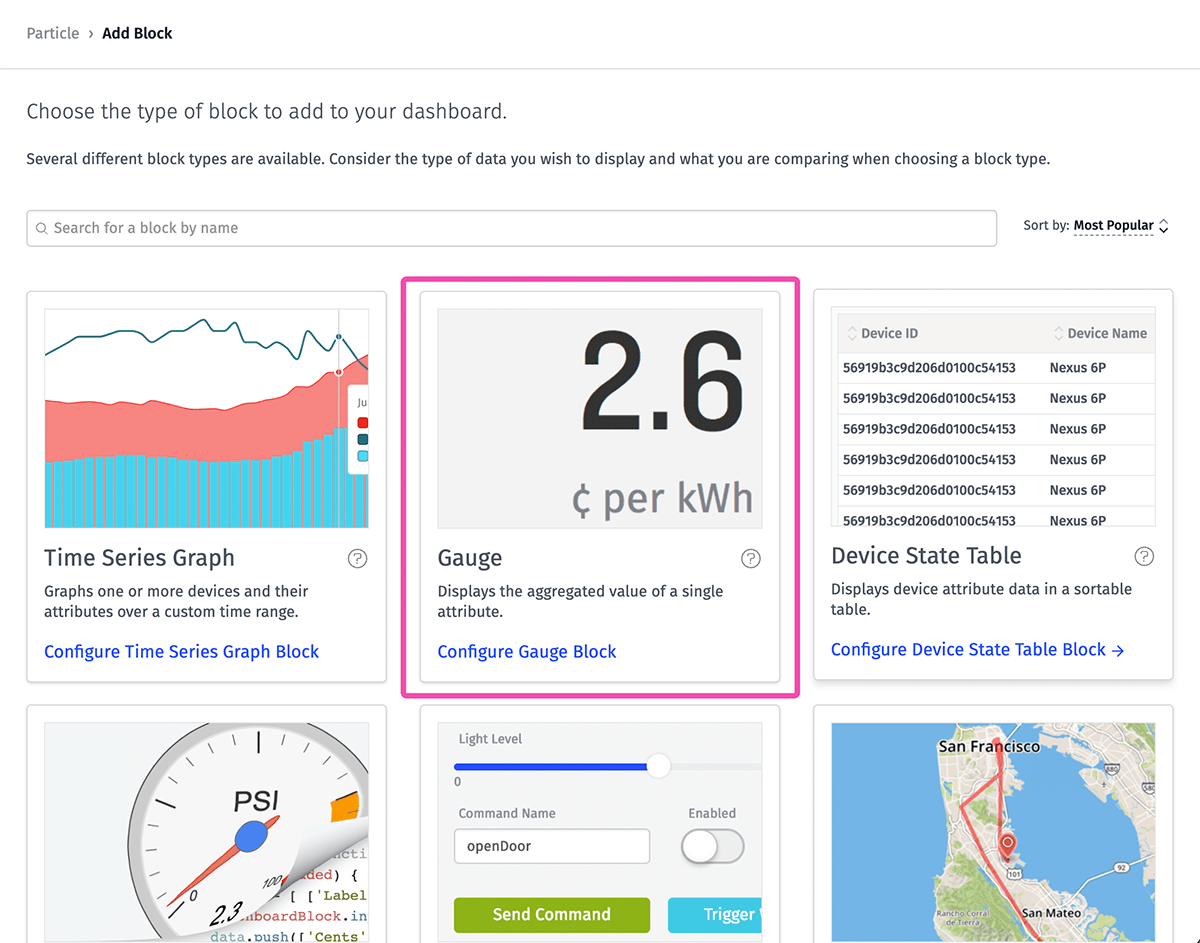
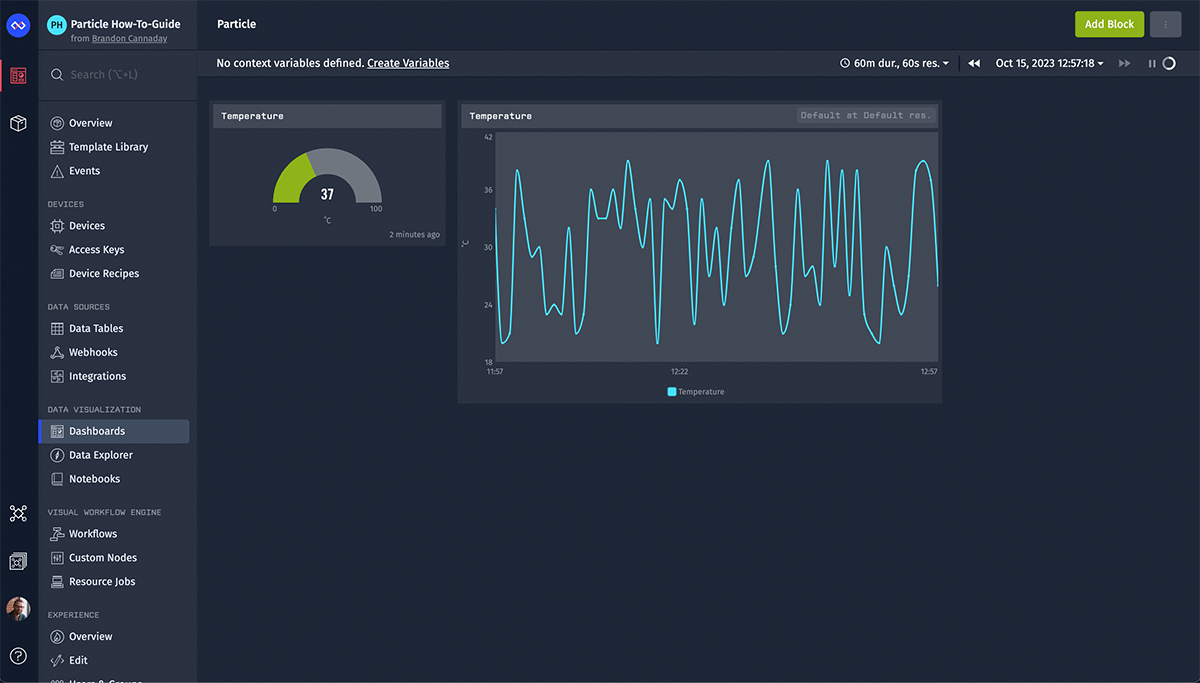
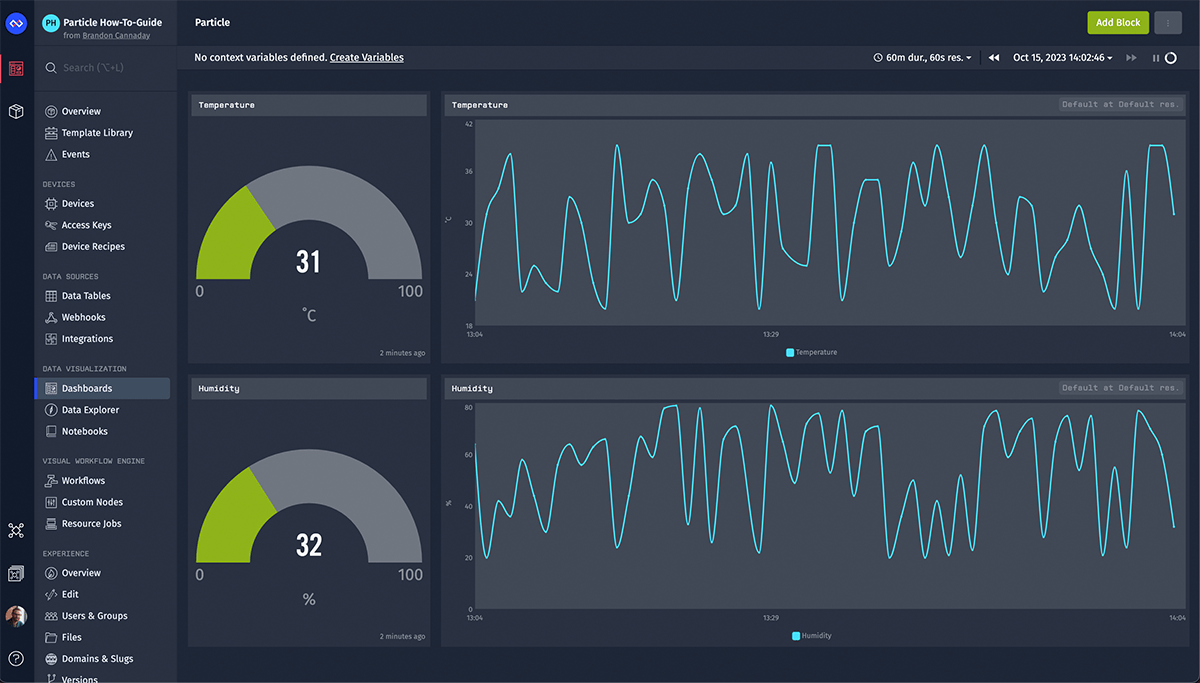
For this guide, we’re going to add a Gauge to show the current temperature value and then a Time Series Graph to show the historical values.
From the Add Block page, select Gauge.
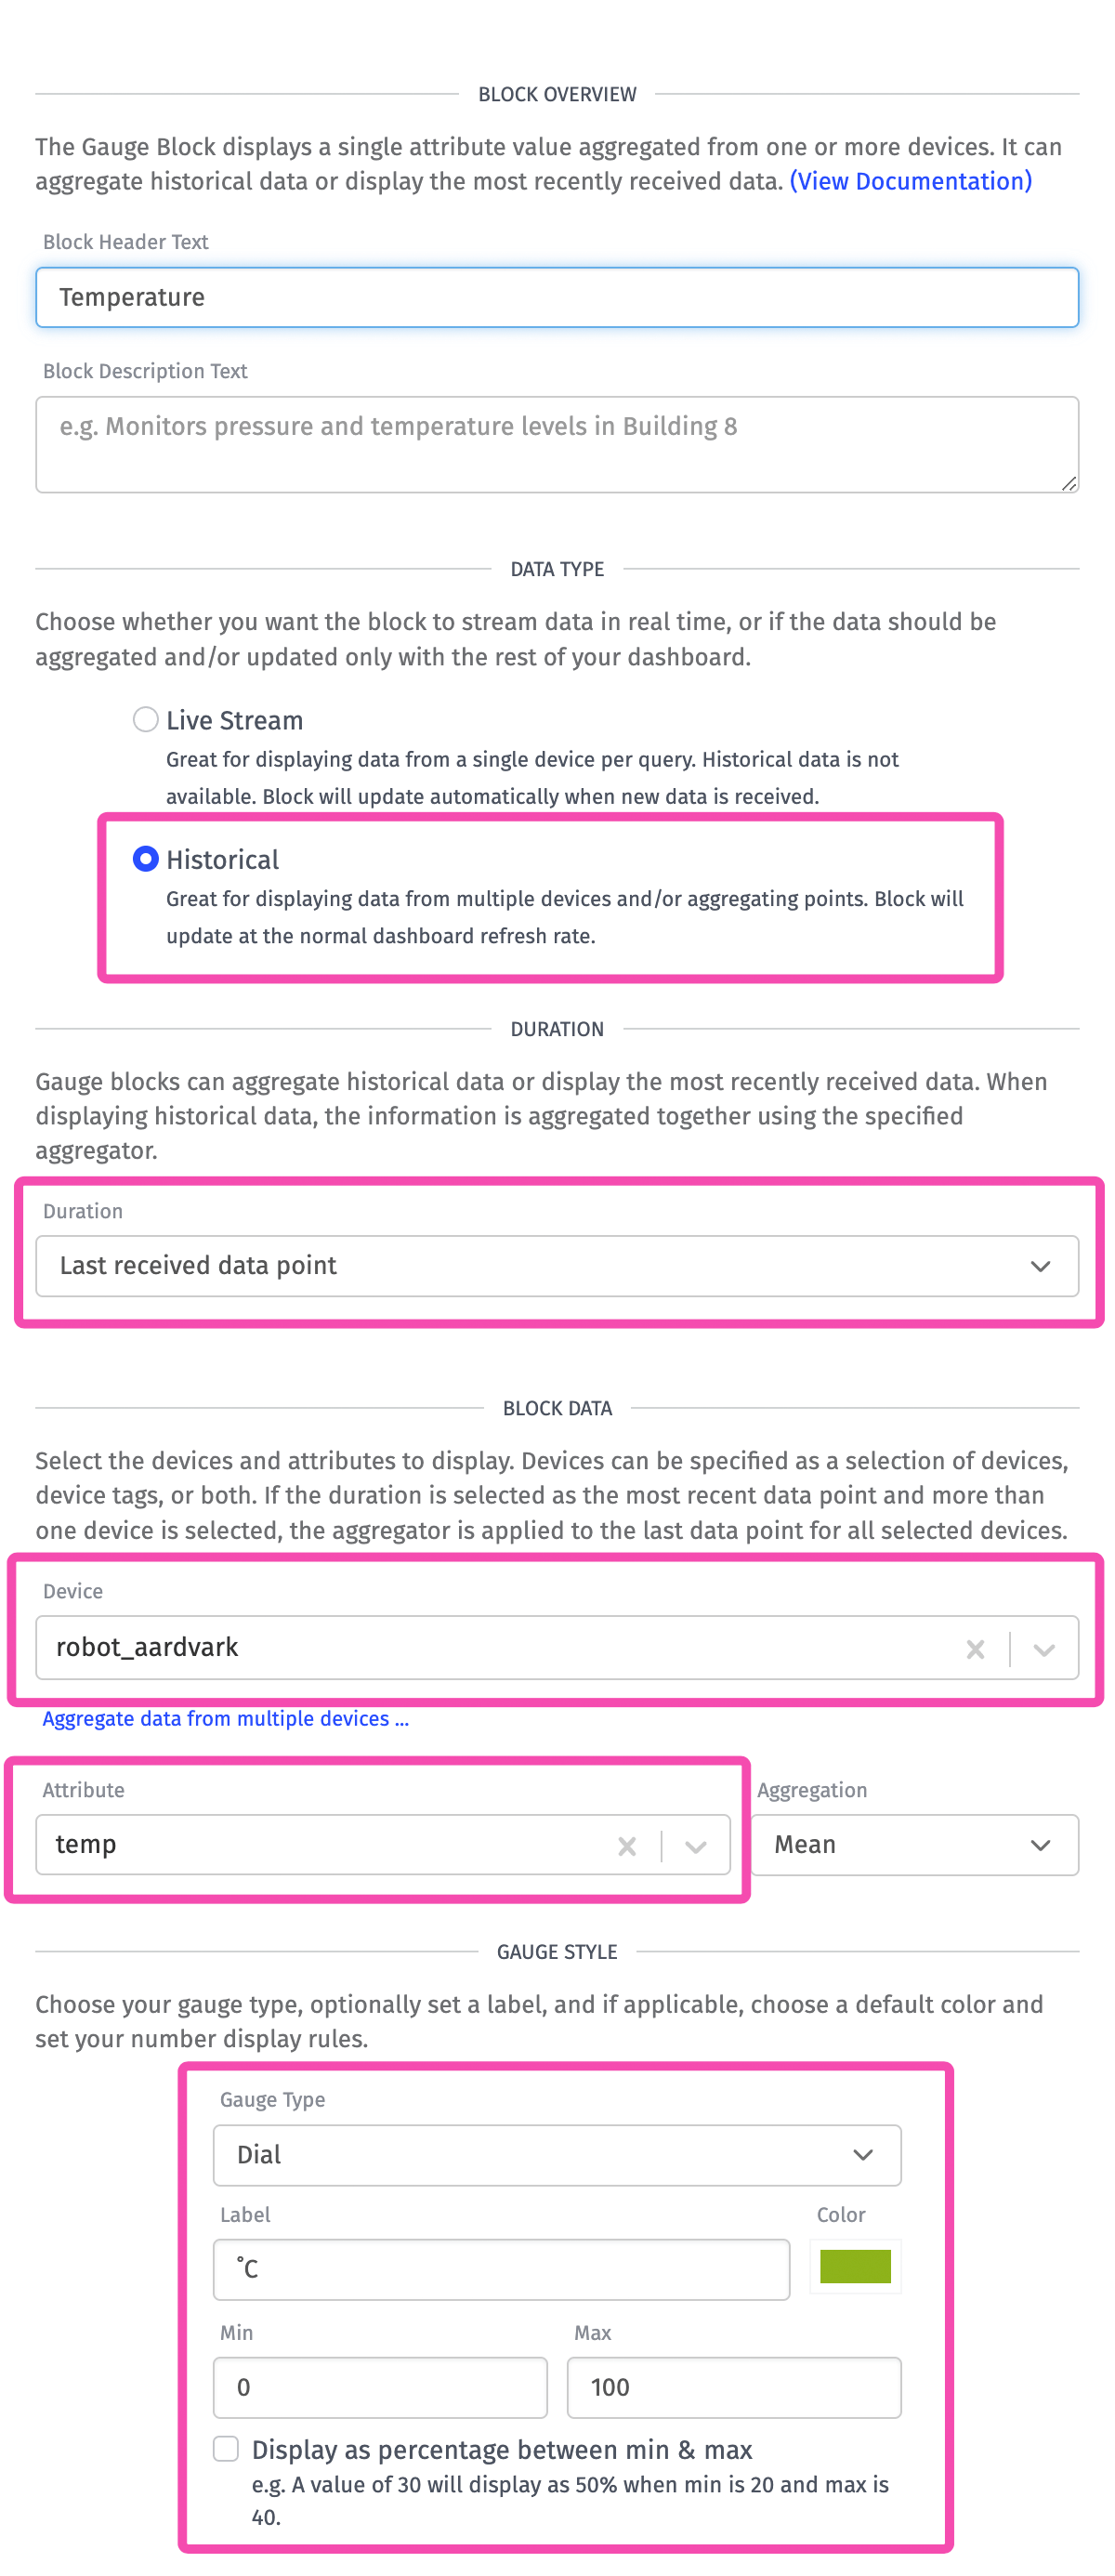
This Gauge Block is using the following configuration:
- Block Header Text:
Temperature- This is the label at the top of the block and can be anything you’d like. - Data Type:
Historical- This is the most common option and will update the value of the block whenever the dashboard timer refreshes. TheLive Streamoption is good for values that change quickly. - Duration:
Last received data point- Whenever the dashboard timer refreshes, the gauge will be updated to the most recent value. - Device:
<YOUR_DEVICE>- The Losant device that represents your Particle device. - Attribute:
temp- This is the attribute that is storing the temperature data. - Gauge Type:
Dial- This changes the visual style of the gauge. Since this is a temperature value, you could also selectThermometer. - Label:
˚C- This is usually set to the units for this value. - Min:
0- This sets the minimum value represented on the gauge. - Max:
100- This sets the maximum value represented on the gauge.
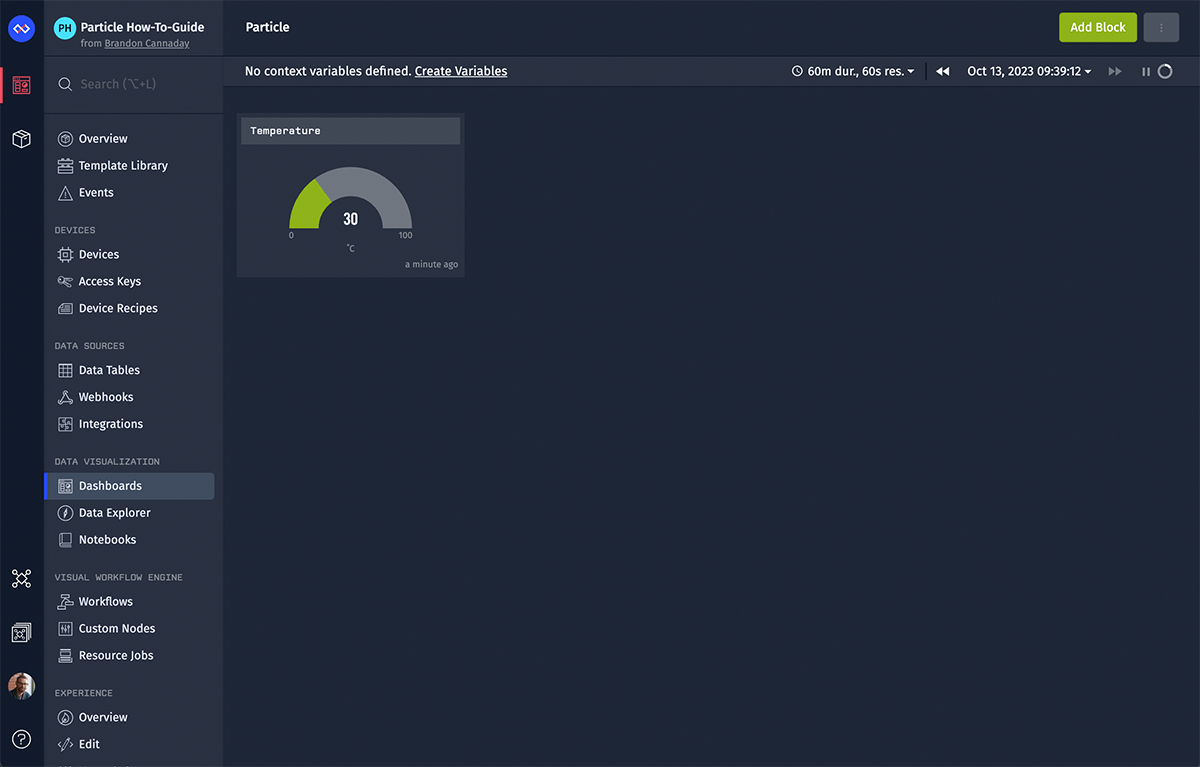
Click Add Block to add this block to your new dashboard.
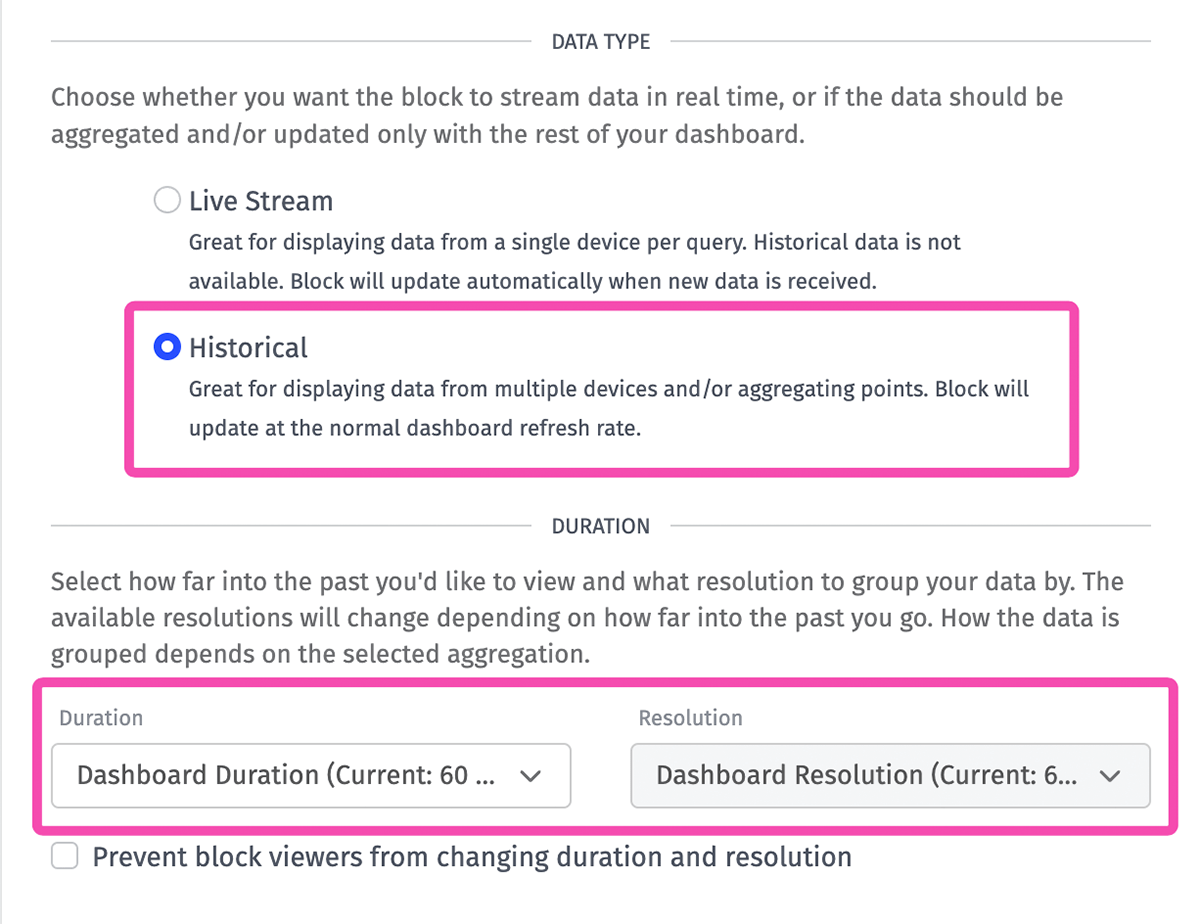
Next, click the Add Block button in the top right corner and select Time Series Graph.
Set the Data Type to Historical and leave the Duration and Resolution set to their default values, which are Dashboard Duration and Dashboard Resolution. Dashboards have a global duration and resolution switcher that can be used to change the configuration for every graph on the dashboard. Alternatively, you can choose a specific duration and resolution if your use case requires it.
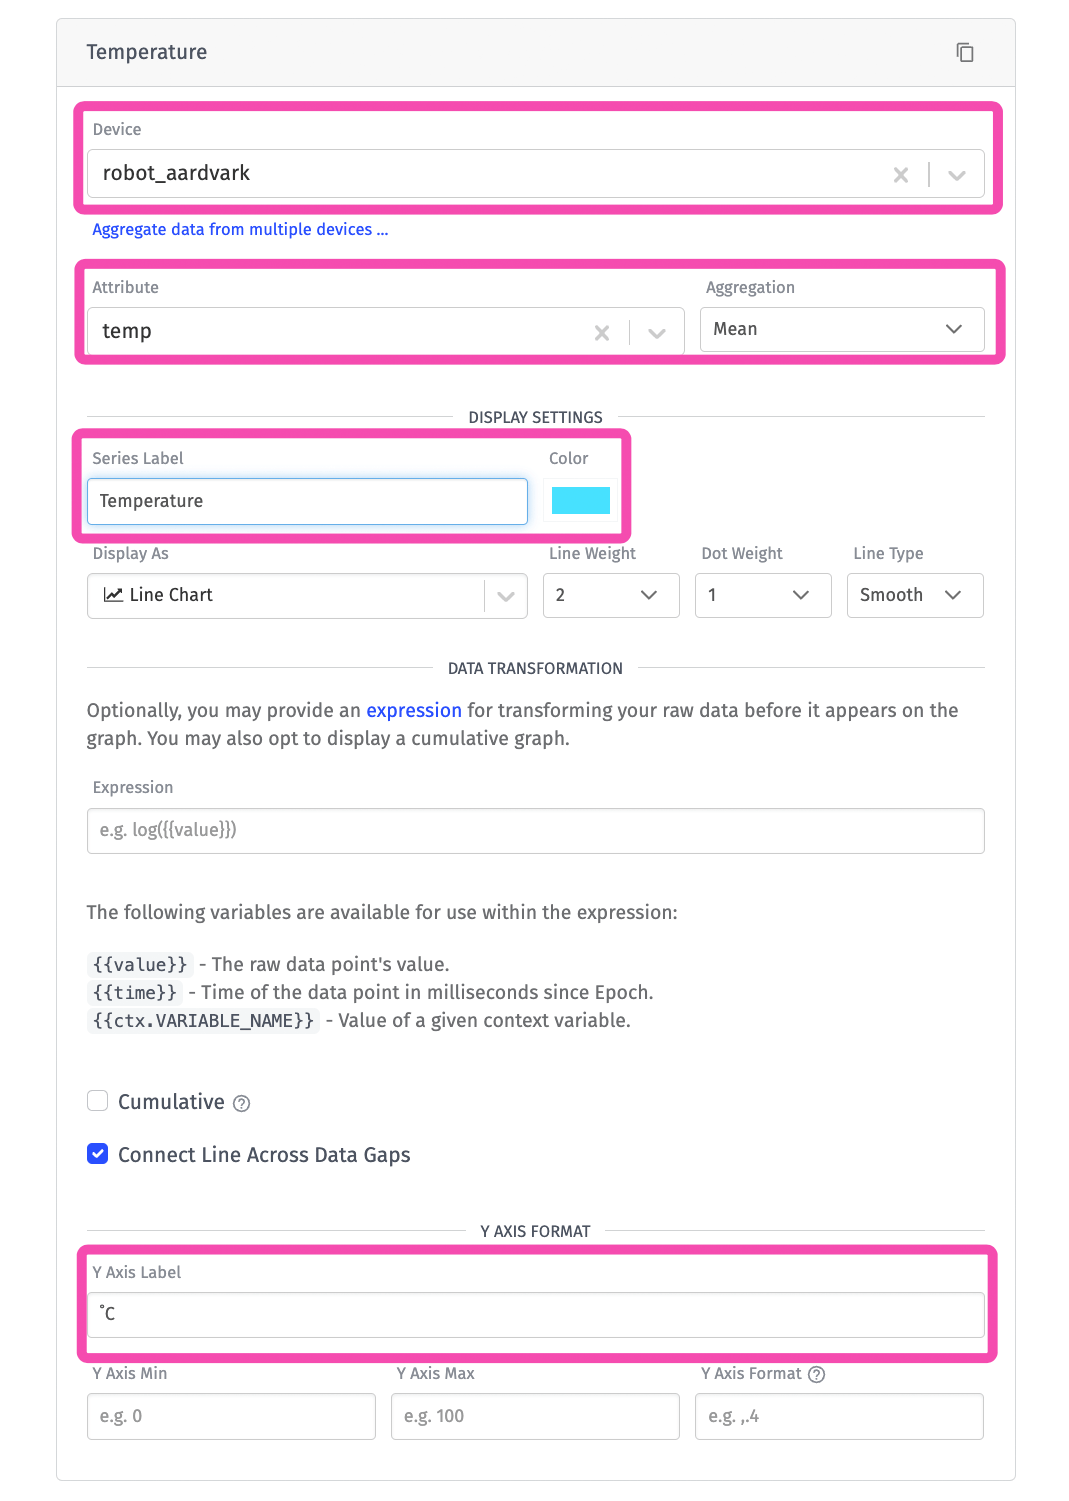
In the Block Data section, we’re going to add a single segment for the temperature data. The segment has the following configuration:
- Device:
<YOUR_DEVICE>- This is the Losant device that represents your Particle device. - Attribute:
temp- This is the attribute that is storing the temperature data. - Aggregation:
Mean- This controls how multiple data points are combined within a single resolution bucket. For example, if you’re graphing 24 hours of data at a resolution of 60 minutes, usingMeanwill take the average of all data points inside each 60-minute bucket. - Series Label:
Temperature- this is the label for the segment displayed along the X axis. - Color:
#0AE1FF- This is the color of the graph line. For this guide, it’s has been set to teal, which looks good against the dashboard’s dark theme. - Y Axis Label:
˚C- This is the label for the Y axis, which is usually the units.
Click Add Block to add this block to the dashboard.
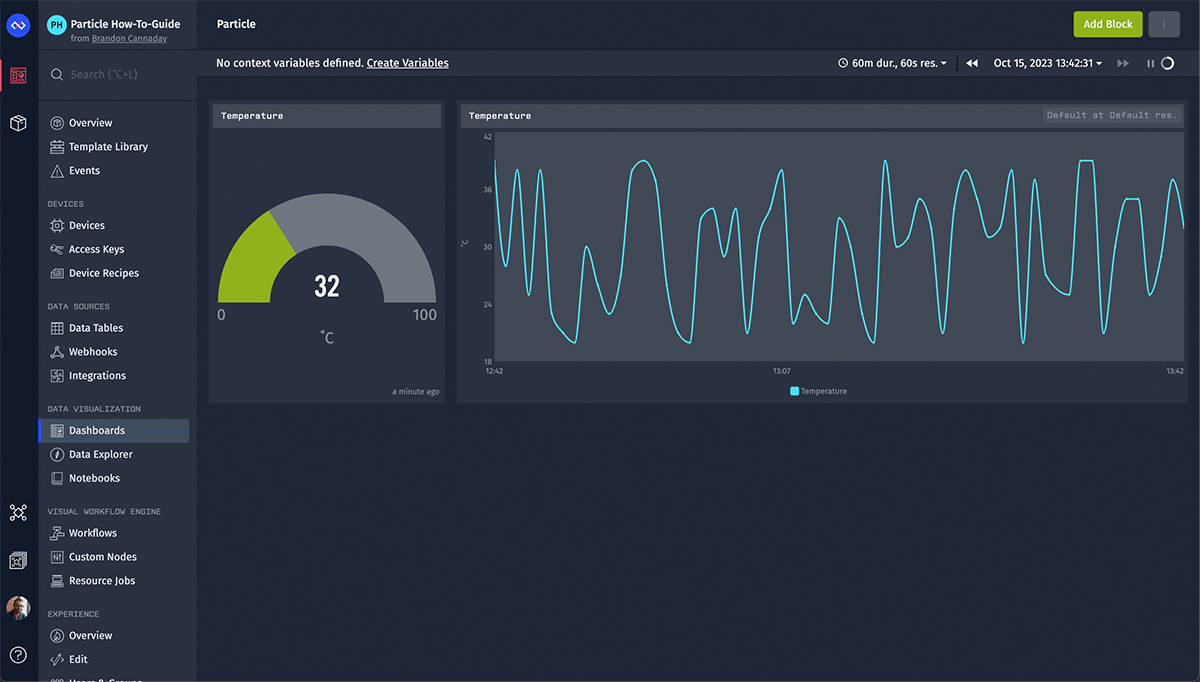
You can now use the drag and resize handles to rearrange and resize the blocks.
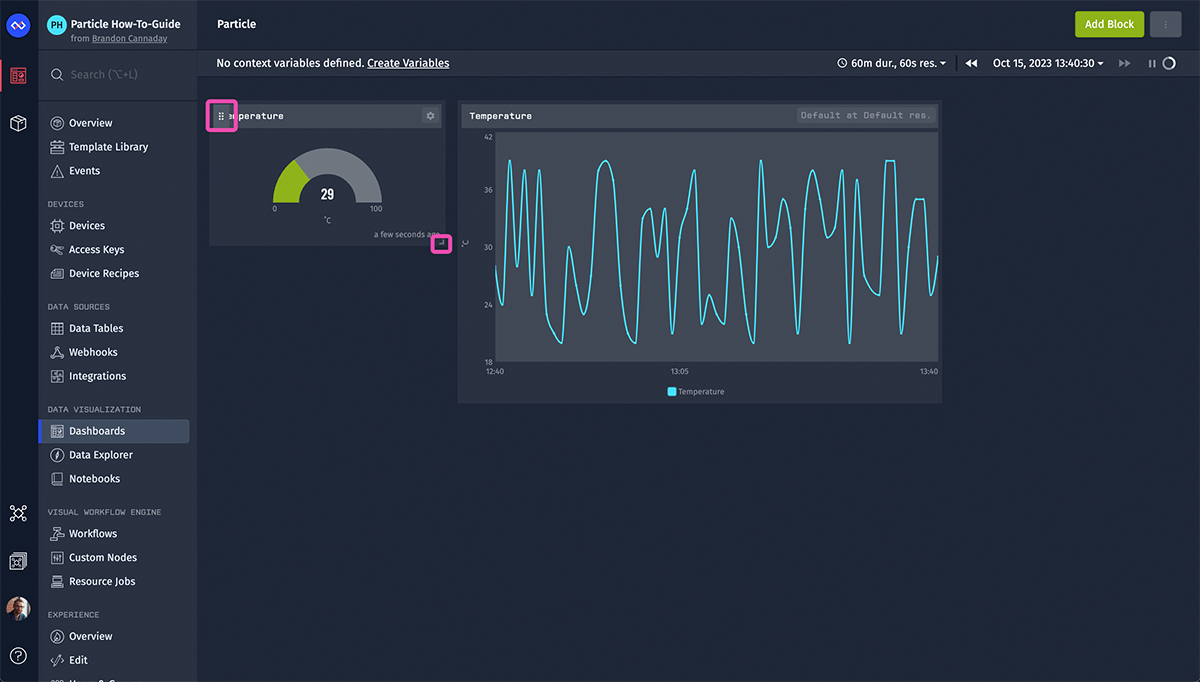
To complete the dashboard, repeat the steps above to add another Gauge Block and another Time Series Graph for the humidity attribute. To speed up the process, you can clone your existing blocks by clicking the gear icon in the top right corner of each block and then selecting Clone Block.
This completes the guide for integrating Particle and Losant. As for next steps:
- Continue exploring Losant dashboards and build visuals specific to your data and use case.
- Build Losant workflows to add real-time alerting and notifications to your incoming Particle data.
- Investigate Losant Experiences to wrap your dashboards in fully branded, multi-tenant, web applications that can be published to your end users.
Was this page helpful?
Still looking for help? You can also search the Losant Forums or submit your question there.