How To Use Losant’s Embedded Edge Agent to Calculate FFT Values
A fast Fourier transform algorithm, or FFT, is used for transforming an array of data points from one domain (such as space or time) into a frequency representation. FFTs are utilized in a lot of different applications, but none are as well known as vibration analysis. A fast Fourier transform allows data points from space to be changed into frequency data points. This is what allows you to capture axial acceleration from an accelerometer and turn that data into a vibration frequency.
Typically, axial acceleration is taken with a small embedded device and reports that data to a gateway, where it is either processed or sent to the cloud for FFT processing. This setup requires extra equipment, and would require your embedded devices to be offline when updated. Now, by leveraging the Losant Embedded Edge Agent (EEA), that data can now be processed on that embedded hardware, and FFT data can now be reported directly to the cloud. The EEA also allows for functionality to be changed over-the-air (OTA), so your devices don’t have to go offline for updates.
In this guide, we’ll be using acceleration data from an accelerometer connected to a Raspberry Pi to do just that.
What You Will Need
Step 1: Prepare the Raspberry Pi
When using the Adafruit ADXL345 with a Raspberry Pi, we must enable CircuitPython libraries to be used with Python programs, and also enable the I2C ports on the Raspberry Pi. The easiest way to accomplish both of these is to follow the Adafruit guide on Installing CircuitPython Libraries on Raspberry Pi.
Once you have completed the setup that Adafruit provides, and have created and successfully run the blinkatest.py example that is provided, you’re ready to move on to wiring up the ADXL345 accelerometer and begin reading values.
Step 2: Reading Accelerometer Values
Before starting with the Embedded Edge Agent (EEA), you first need to get your Raspberry Pi wired to read accelerometer values and output those values to your terminal.
Here’s the wiring diagram:
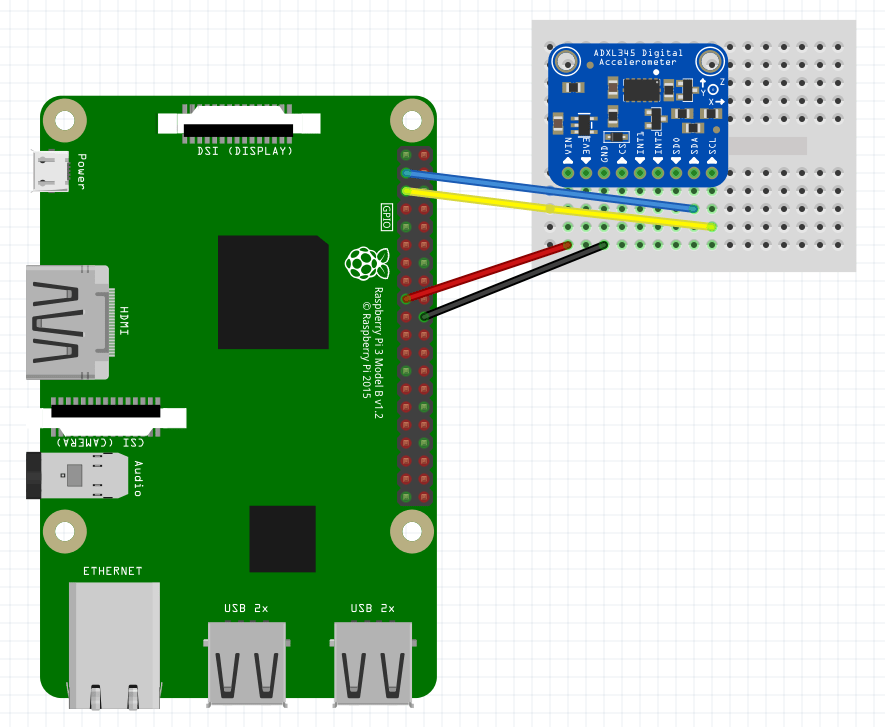
Here’s how we’re connecting these two devices:
- Pin 3 on Raspberry Pi to SDA pin on accelerometer
- Pin 5 on Raspberry Pi to SCL pin on accelerometer
- Pin 17 (3.3v power) on Raspberry Pi to VIN pin on accelerometer
- Pin 20 (GND) on Raspberry Pi to GND pin on accelerometer
SSH into your Raspberry Pi
All of the commands issued in this guide are issued to your Raspberry Pi terminal via SSH. If you need guidance on how to SSH into your Raspberry Pi, you can check out this video and this blog post.
Next, in your Raspberry Pi’s terminal, install the required library for this package, which we can do by running the following command:
pip3 install adafruit-circuitpython-adxl34xOnce the accelerometer library has successfully installed on your device, you’re ready to read some data!
First, clone this repository and change directory into the project with the below commands. The code included in this repository is broken up by each step.
git clone https://github.com/Losant/eea-fft-how-to.git
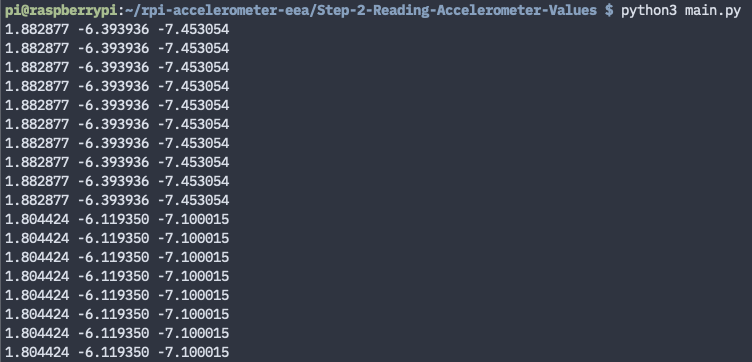
cd rpi-accelerometer-eea/Step-2-Reading-Accelerometer-ValuesThen run the main file in that directory with the following command:
python3 main.pyHere’s what your terminal should look like (colors varying):
Here’s the code you just ran:
# example from https://github.com/adafruit/Adafruit_CircuitPython_ADXL34x
import time
import board
import adafruit_adxl34x

i2c = board.I2C()  # uses board.SCL and board.SDA
accelerometer = adafruit_adxl34x.ADXL345(i2c)
accelerometer.data_rate = 3200

while True:
    print("%f %f %f"%accelerometer.acceleration)
    time.sleep(1)
This program reads the accelerometer values once a second and outputs them (x, y, and z) to your terminal.
Once you are able to run that program successfully, we can move on to using the EEA. If the program failed, take note of the error that was presented. If you are receiving errors, then check your wiring of the sensor and walk through the setup steps provided in Step 1. The best place to receive support at this stage is the Adafruit community. You can check out their forums or open a GitHub issue with the library used.
Step 3: Implementing the Losant Embedded Edge Agent (EEA)
The EEA Walkthrough is a great place to get started with the Losant EEA. We strongly recommend that you go through the walkthrough to get a better understanding of how the EEA works and how you will be interfacing your program with it.
After you have gone through the walkthrough and are able to successfully run the Hello World EEA example, we can start to add the bits we need to be able to read the accelerometer with the EEA.
Note: You will need to create an Embedded Device and an Access Key before proceeding. Once you have obtained a device ID, access key, and access secret you can continue with this step and the rest of this guide.
To start, in the repository that you cloned in Step 2, change directory into the Step 3 folder (the following command assumes you are already in the Step 2 folder):
cd ../Step-3-Implementing-the-EEAThen, you can run the following command to connect your Raspberry Pi to the Losant platform as an Embedded Device:
DEVICE_ID=<embedded device id> ACCESS_KEY=<access key> ACCESS_SECRET=<access secret> python3 main.pyWith device credentials included, your command will look similar to this:
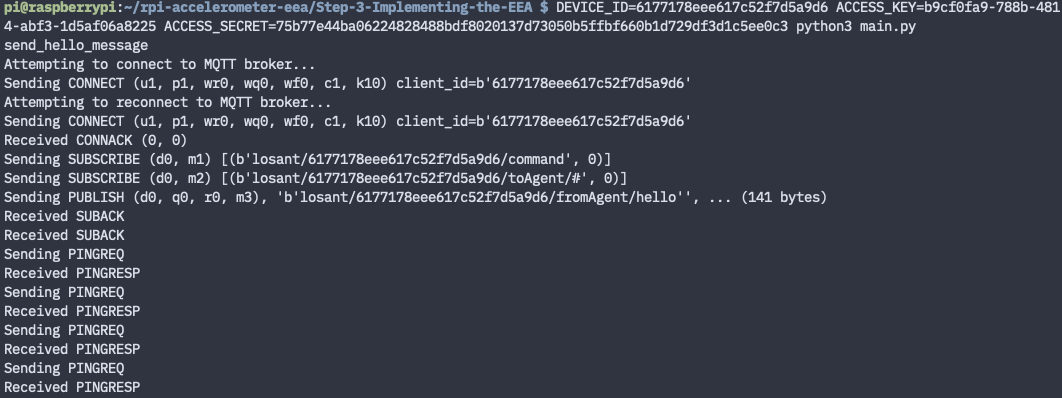
DEVICE_ID=616f38e0a48c0ed7634c2e9a ACCESS_KEY=d14e5746-a1e5-46d4-9725-cfe4c1a7645d ACCESS_SECRET=e59420f0d75873950b189680260f89937e769e52cf195e0960f7d67a457b8a57 python3 main.pyThe example code provided uses trace level 2, or verbose, so in your terminal output you should see your device connect to the Losant MQTT Broker and output a series of PINGREQ & PINGRES, which are MQTT messages that ensure the device is maintaining its connection to the broker.
Your terminal output should look something like this:
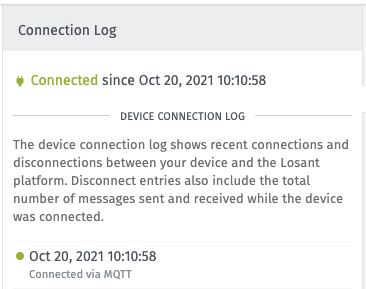
Then, in your Device Log, you should see that your device connected.
Now that your Embedded Device is connected the Losant platform, we’re ready to add our own registered function to read accelerometer data.
Step 4: Write the Registered Function to Read the Accelerometer
A registered function is a way for an Embedded Workflow to invoke custom functions that you write into your firmware. We highly recommend that you read the[documentation on registered functions]/edge-compute/embedded-edge-agent/agent-api/#registered-function-api) before proceeding.
To add the registered function read_accelerometer, we need to first open the file that contains our registered functions. In the example code provided in the repository you cloned, a file with registered functions has already been created. To open this file in your Raspberry Pi’s terminal, use the following command inside of the example code directory (this command assumes you are in the Step-3 directory):
cd ../Step-4-Write-the-read_accelerometer-Registered-Function
cat eea_registered_functions.py
This command uses the cat command to view the contents of the file. It should look something like this:
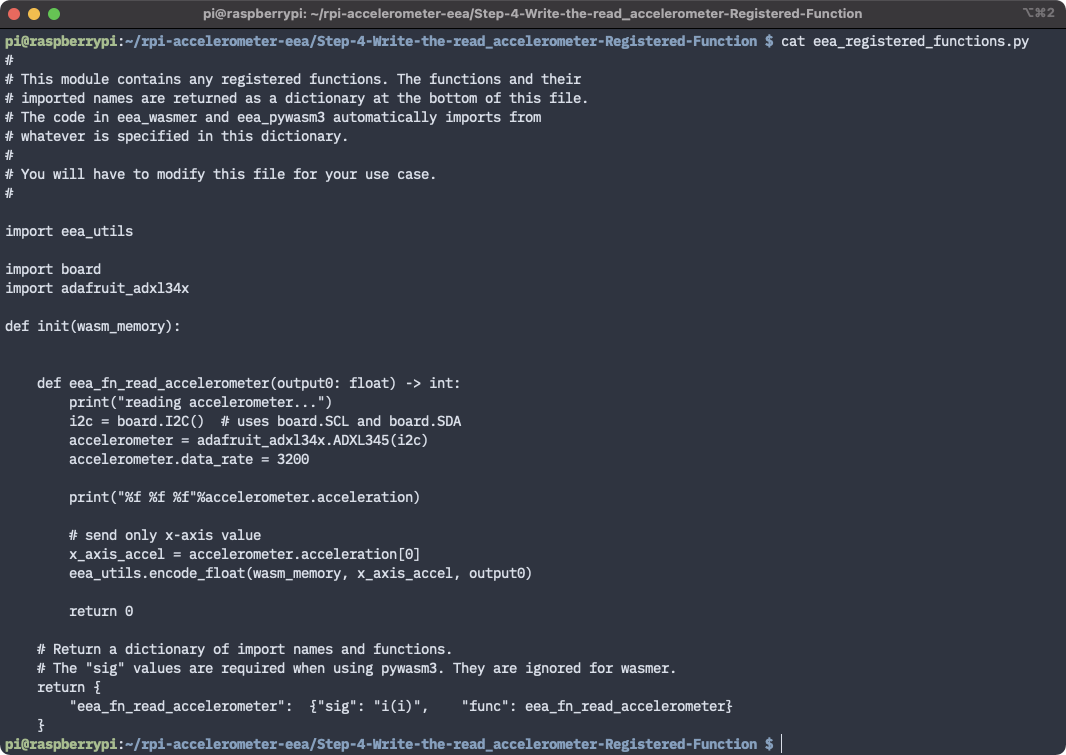
First, we need to import the libraries that we used in the first accelerometer test that we did in Step 2. Since this file is already including time, all we need to add is board and adafruit_adxl34x. So, your import list at the top of the file should include the following:
import eea_utils

import board
import adafruit_adxl34x
To add the read_accelerometer function to our code, paste the following function under the def eea_fn_custom_trace function:
def eea_fn_read_accelerometer(output0: float) -> int:
    print("reading accelerometer...")
    i2c = board.I2C()  # uses board.SCL and board.SDA
    accelerometer = adafruit_adxl34x.ADXL345(i2c)

    print("%f %f %f"%accelerometer.acceleration)

    # send only x-axis value
    x_axis_accel = accelerometer.acceleration[0]
    eea_utils.encode_float(wasm_memory, x_axis_accel, output0)

    return 0
We did change this function a little bit, so let’s walk through it.
- Removed the
while(true)statement. This part is no longer needed in our function because the EEA will loop for us once we deploy a workflow with a Timer Trigger. - Kept
print("%f %f %f"%accelerometer.acceleration)so that in your terminal you can see the value of the X, Y, and Z acceleration, but we are only passing along the X axis value to the EEA withx_axis_accel = accelerometer.acceleration[0]. - Added
eea_utils.encode_float(). This is a utility function provided to you in the example repository that encodes the float value read by the accelerometer.
Now, you can send the same start command from Step 3 to start your Embedded Device back up:
DEVICE_ID=<embedded device id> ACCESS_KEY=<access key> ACCESS_SECRET=<access secret> python3 main.pyWhen your device reconnects to Losant, it’s time to build and deploy an Embedded Workflow.
Step 5: Build and Deploy your Embedded Workflow
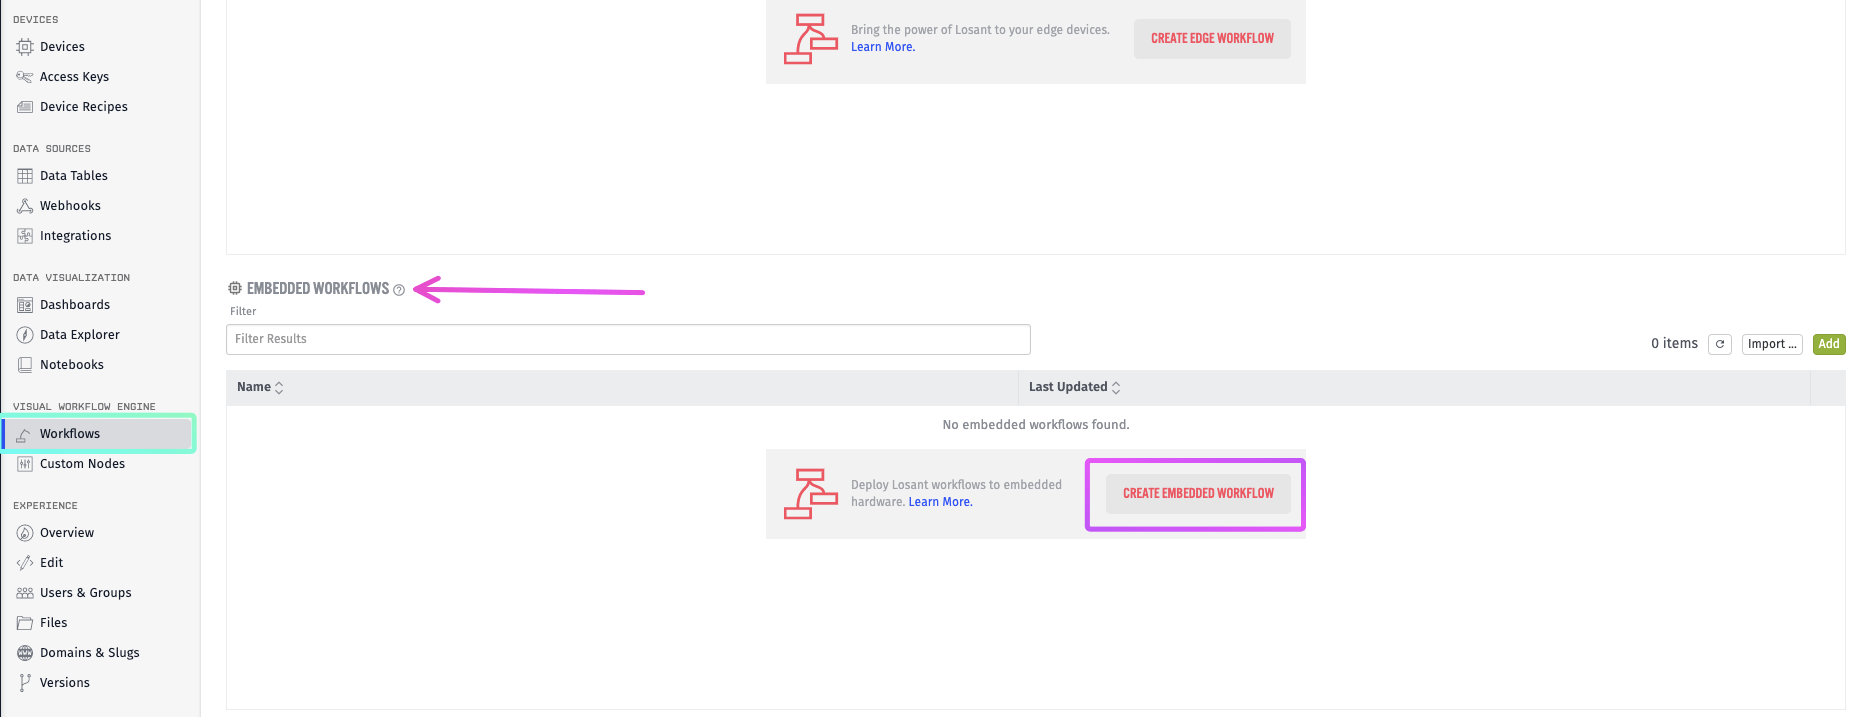
To create an Embedded Workflow, go to the “Workflows” page in your Losant application, and scroll to the bottom, and in the “Embedded Workflows” section, click “Create Embedded Workflow”:
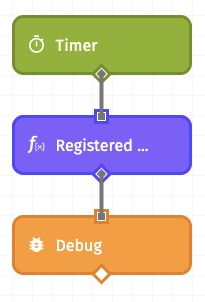
After you name your workflow, you’ll be taken to the workflow canvas. Here, we’ll add:
- A Timer Trigger with an interval of 15 seconds.
- A Registered Function Node (which we’ll configure next).
- A Debug Node.
Your workflow should look like:
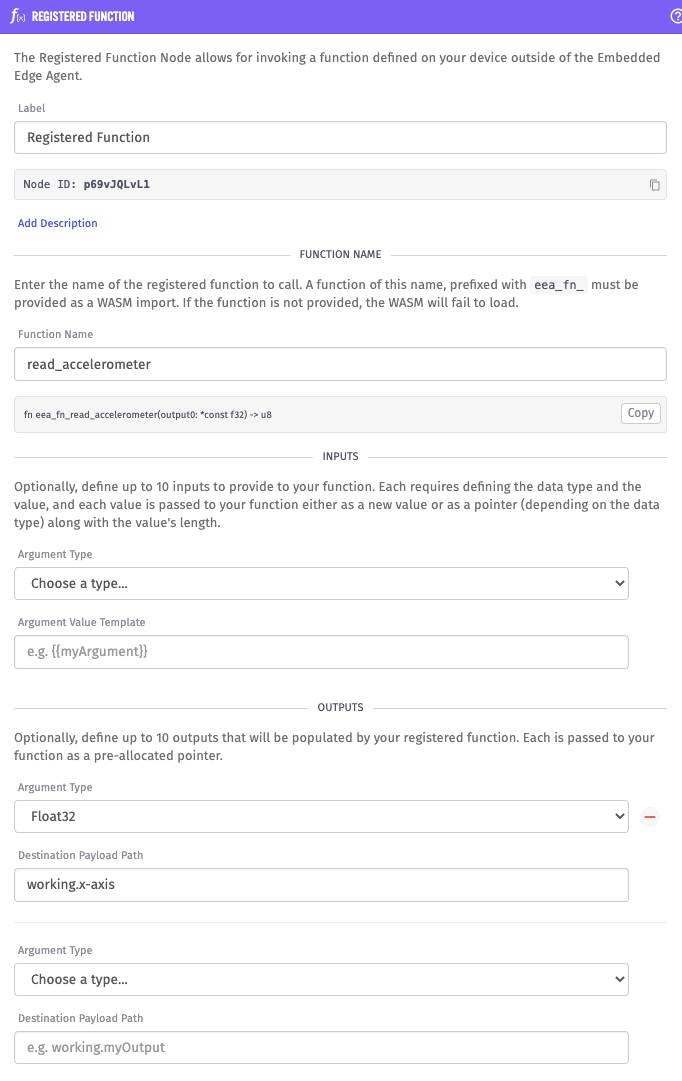
Here’s the configuration we’ll be using for the Registered Function Node:
As mentioned before, the best place to learn more about the Registered Function Node is in our documentation, but there are a few things to point out:
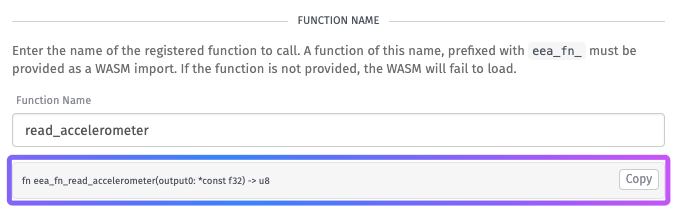
- In our code, we used the function name
eea_fn_read_accelerometer, but in our node configuration we are naming the function justread_accelerometer. This is required for all registered functions so that your registered functions do not have naming conflicts with the internal functions Losant uses for the EEA. - You are required to choose the inputs and outputs along with the types of those inputs and outputs. In this case, our function does not have any inputs, but has one 32-bit float as an output (the x-axis acceleration value). As you can see, outputs are passed to your function as pre-allocated pointers.
- As you add inputs and outputs, Losant builds a Rust function declaration statement for you right under the Function Name text box. This is helpful in understanding how to format your function, and what value types are required for which input and output.
- We are placing the value of our Registered Function output at the payload path
working.x-axis.
Once you have configured the Registered Function Node, you are ready to deploy your workflow to your Embedded Device. Click the “Deploy” button in the top right of the screen, and a modal will pop up:
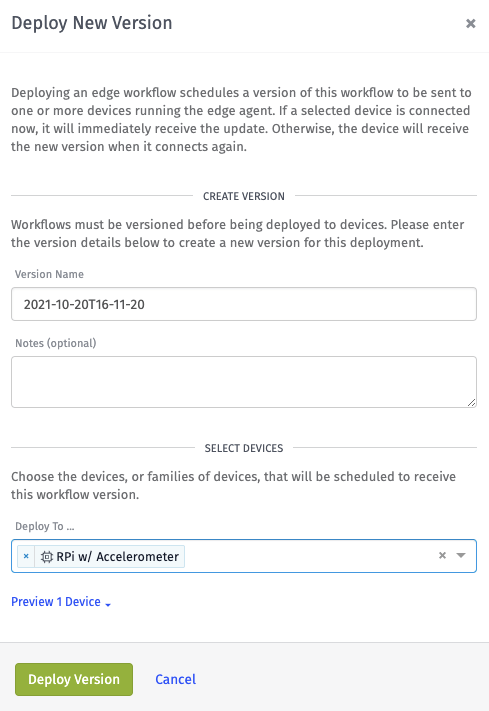
Select the Embedded Device that you created, and click “Deploy Version” to finish deploying this version of this workflow to your device.
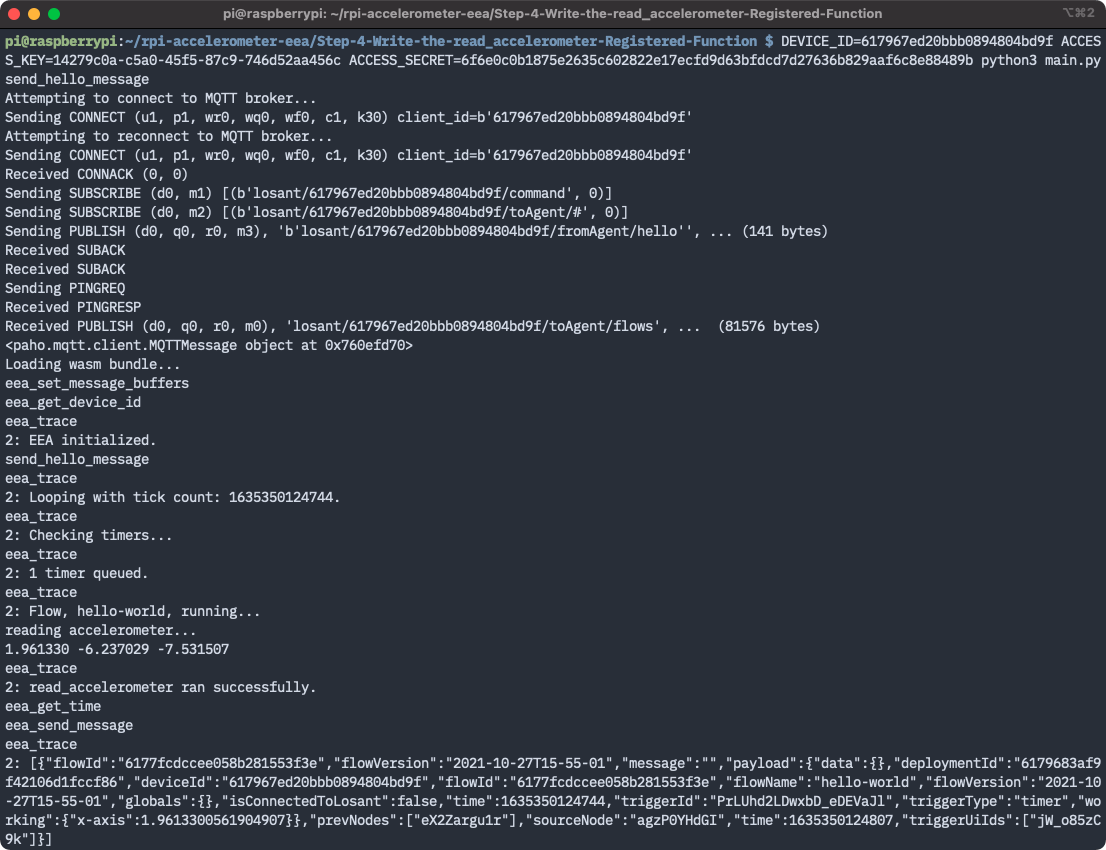
Then, in your Raspberry Pi terminal, you should see something similar to this:
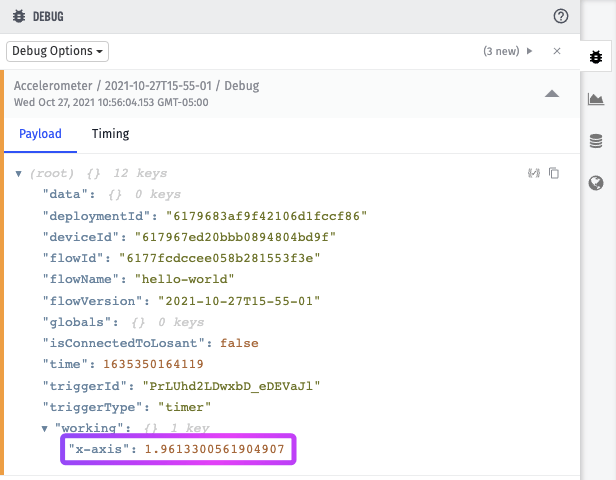
And, after opening the device’s Live Look, you should start to see debug messages come in from your device:
Now that you’re able to read the accelerometer, let’s make some adjustments to the EEA and our workflow so we can do FFT analysis.
Step 6: Adjust Workflow and Registered Function for FFT Analysis
To start calculating FFTs for our dataset, first we’ll need to add some additional code to our read_accelerometer registered function in our code. So, just like in Step 4, open the eea_registered_functions.py file, and edit our registered function with the following code:
def eea_fn_read_accelerometer(output0: int, output0_length: int, output0_result_length: int, output1: int) -> int:
    print("reading accelerometer...")
    i2c = board.I2C()  # uses board.SCL and board.SDA
    accelerometer = adafruit_adxl34x.ADXL345(i2c)

    # List to append acceleration data to
    accel_data = []

    # number of accelerometer readings to make
    num_loops = 1024

    # Check to make sure the available output length is big enough for the encoding.
    if num_loops > output0_length:
        return

    # Read the accelerometer num_loops number of times.
    time_start = time.time()
    for i in range(num_loops):
        accel_data.append(accelerometer.acceleration[0])

    time_end = time.time()

    sample_rate = (time_end-time_start) / num_loops

    print("sample rate: %f" % sample_rate)

    eea_utils.encode_float(wasm_memory, sample_rate, output1)

    # Encode all the results
    for i in range(num_loops):
        eea_utils.encode_float(
            wasm_memory, accel_data[i], output0 + (i * 4))

    # Encode the number of items written
    eea_utils.encode_int(wasm_memory, num_loops, 4, output0_result_length)

    return 0
As you can see, our function changed a lot, so let’s break it down.
Our function declaration now includes a lot more:
def eea_fn_read_alot_accelerometer(output0: int, output0_length: int, output0_result_length: int, output1: int) -> int:This is because we are now outputting an array of float values rather than just a single float value, as well as a float value for the sample rate. You can read more about the array outputs in the Registered Function Node documentation, but here’s what each output is:
output0is a pointer to the array of encoded float values that we read from the accelerometer.output0_lengthis the value provided in the output’s “Max Length” property. In other words, it’s the length that we say the array is.output0_result_lengthis the length of the array that is being output, i.e. the number of items in the array.output1is a pointer to the value of our sample rate.
Next, we defined a Python list to append the accelerometer readings to, and also implemented a check to make sure that the number of times that we looped is not bigger than the value length that we said this array would be:
# List to append acceleration data to
accel_data = []

# number of accelerometer readings to make
num_loops = 1024

# Check to make sure the available output length is big enough for the encoding.
if num_loops > output0_length:
    return
Then, we moved the reading of the accelerometer inside of a loop, and are appending each reading to the list that we defined. Also, we use time.time() before and after the loop to determine how long it took to read all of those values. Then we use the encode_float utility again to encode the sample rate value we calculate:
# Read the accelerometer num_loops number of times.
time_start = time.time()
for i in range(num_loops):
    accel_data.append(accelerometer.acceleration[0])

time_end = time.time()

sample_rate = (time_end-time_start) / num_loops

print("sample rate: %f" % sample_rate)

eea_utils.encode_float(wasm_memory, sample_rate, output1)
Finally, we looped through the accel_data list to encode each reading and ended this function by encoding the value of the number of loops that took place (e.g. 1024).
Note: In the encode_float utility function we have to offset the value by the size of a float, i.e. 4 bytes, which is why we use output0 + (i * 4) in the encode_float function.
# Encode all the results
for i in range(num_loops):
    eea_utils.encode_float(
        wasm_memory, accel_data[i], output0 + (i * 4))

# Encode the number of items written
eea_utils.encode_int(wasm_memory, num_loops, 4, output0_result_length)

return 0
We also need to add another registered function called eea_fn_base64_encode. Here’s what that function looks like:
#
# Encodes a string to base64.
#
def eea_fn_base64_encode(ptr_str: int, str_len: int, out_ptr_encoded_str: int, str_buffer_len: int, out_ptr_encoded_str_len: int) -> int:
    print("eea_fn_base64_encode")
    input = eea_utils.decode_string(wasm_memory, ptr_str, str_len)
    encoded = base64.b64encode(input.encode("utf-8")).decode("utf-8")
    eea_utils.encode_string(
        wasm_memory, encoded, out_ptr_encoded_str, str_buffer_len, out_ptr_encoded_str_len)
    return 0
This function is necessary to encode the array data from both the read_accelerometer function and the Fast Fourier Transform Node that we will add to our workflow. This allows us to save both arrays as blob attributes for the device.
Now that the registered function is updated, let’s update the Embedded Workflow to also represent these changes. First, update the Registered Function Node configuration to represent the new outputs:
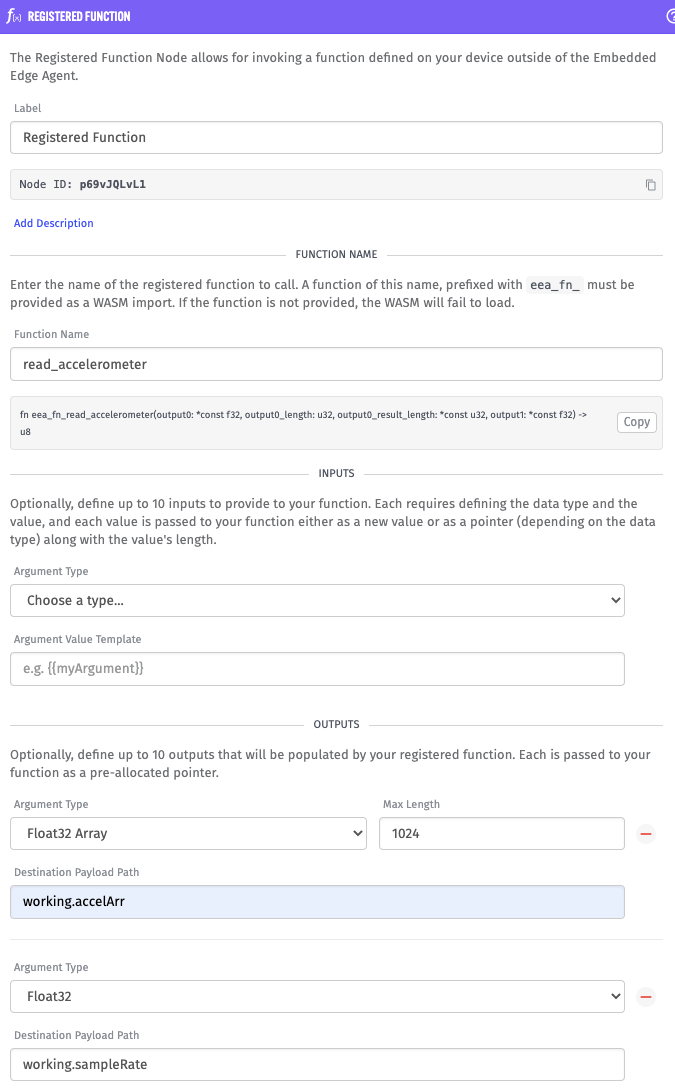
The first output is updated to represent an array of 32-bit floats, which is being placed at the payload path working.accelArr, and another output is added with a type of 32-bit float to be placed at the payload path working.sampleRate.
Note: As mentioned in Step 5, as the inputs and outputs are updated, Losant builds an example Rust function declaration statement just under the Function Name text box.
Then, add a Fast Fourier Transform Node, a Mutate Node, a Root Mean Square Node, two JSON: Encode Nodes, a Device State Node, and two Registered Function Nodes that invoke the function base64_encode. Here’s what the workflow will look like (download it here):
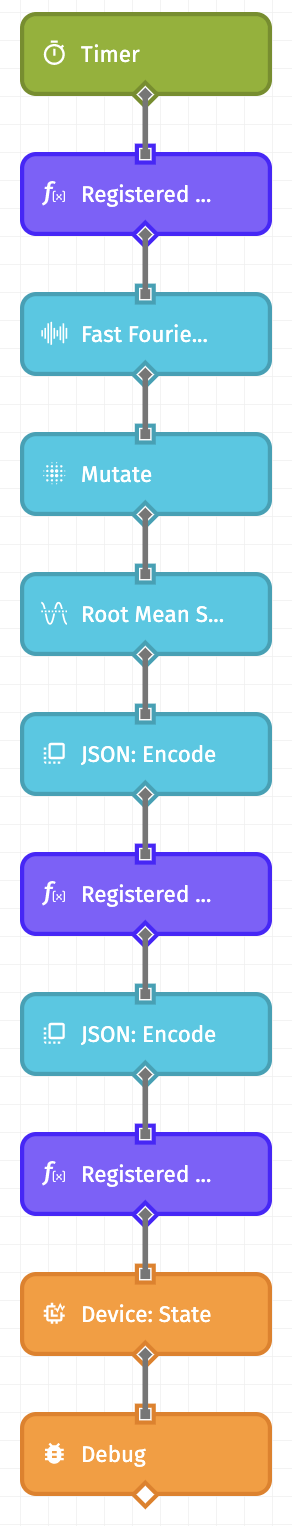
There are a lot of new nodes to cover, so let’s go over each one. The Fast Fourier Transfer Node will have the following configuration:
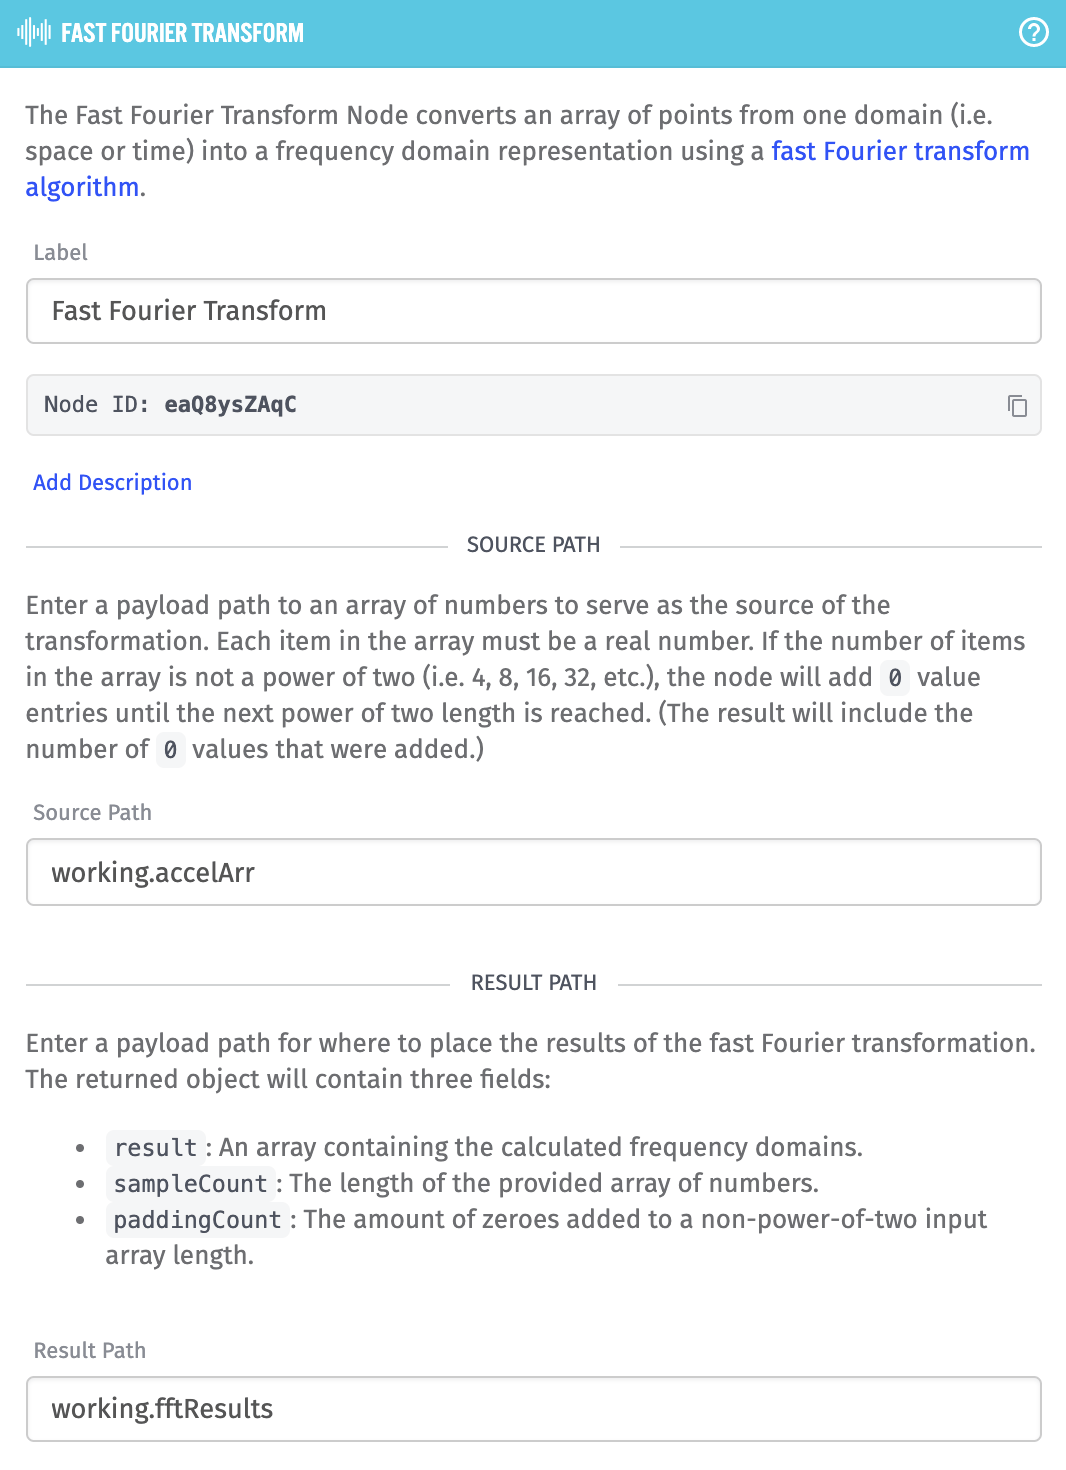
The source path for the FFT Node is the output of the Registered Function Node, or working.accelArr, and the result path of the node is working.fftResults.
Then, the Mutate Node has the following configuration:
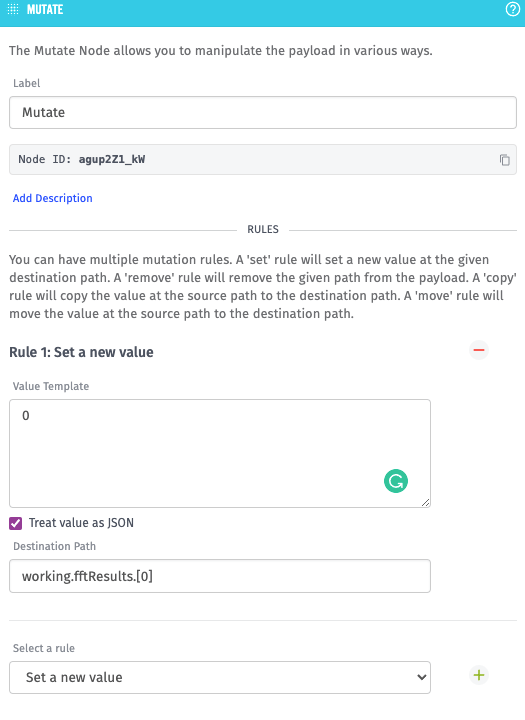
In FFT analysis, the first item (i.e. the zeroth index), should be ignored, so the Mutate Node sets that value to 0 with the Value Template of 0 and the “Treat as JSON” checkbox checked. The destination path is set to working.fftResults.[0].
Next is the Root Mean Square Node:
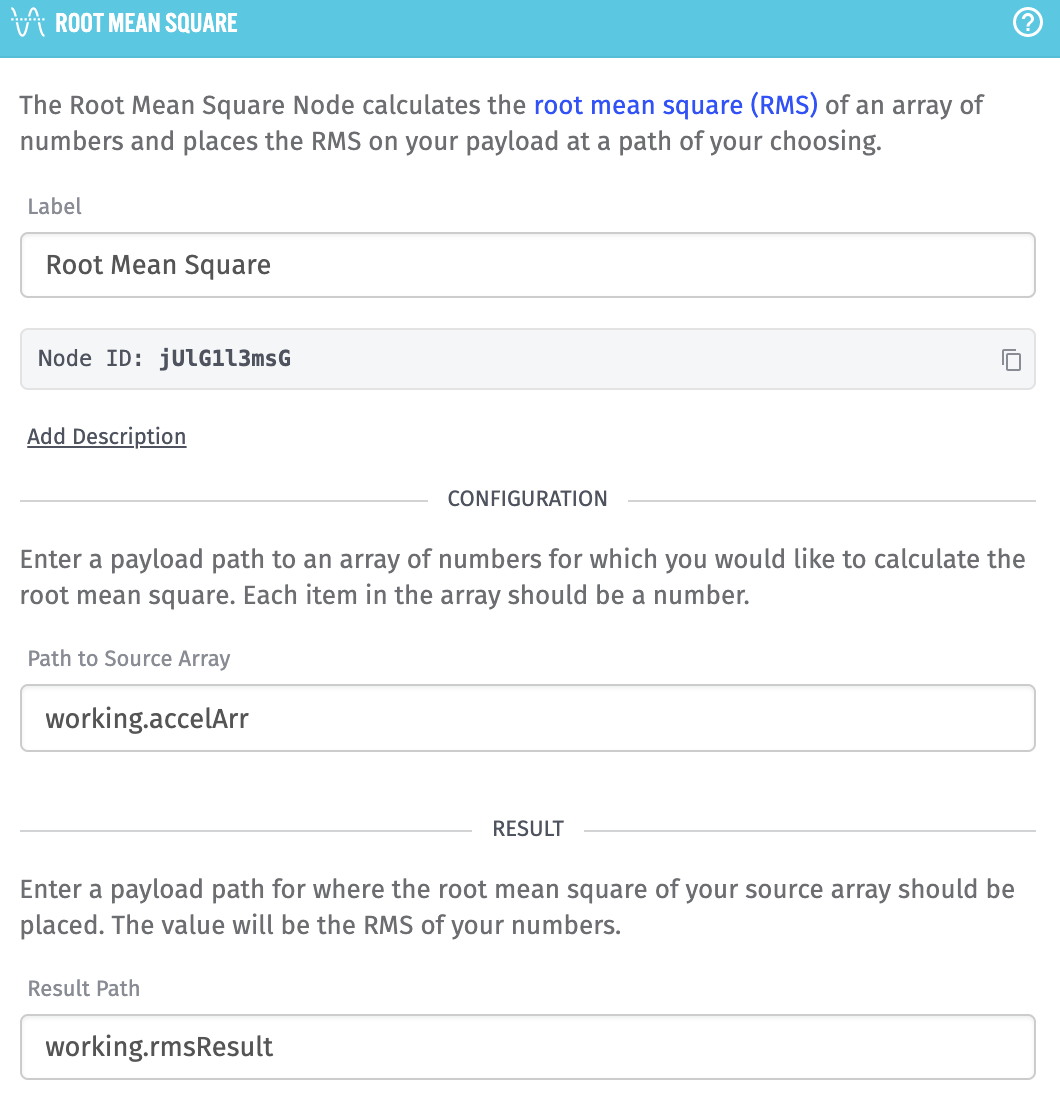
In this case, we’re calculating the root mean square of the FFT analysis, or working.accelArr, and placing the result at the payload path working.rmsResult.
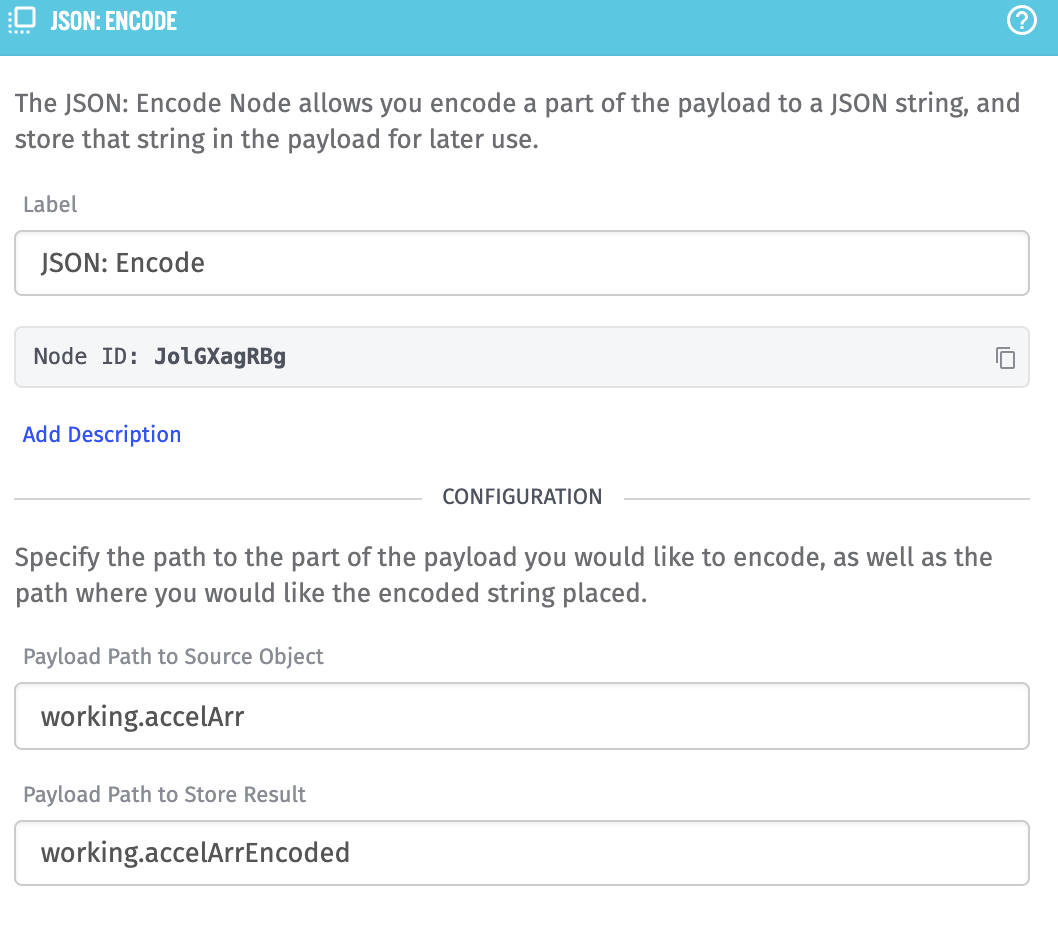
Finally, the two JSON: Encode and Registered Function Node pairs. Both sets are JSON encoding an array, then Base64 encoding them to be saved as blob attribute data. The first JSON Encode Node encodes the working.accelArr and places it on the payload at working.accelArrEncoded:
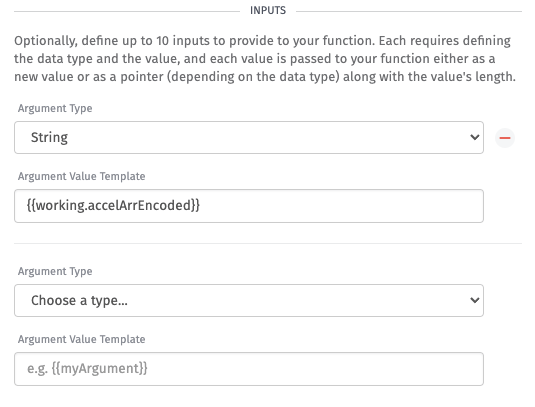
Then the Registered Function invokes the base64_encode registered function. This Registered Function takes a single string as an input, which we set to the JSON-encoded FFT data, or {{working.accelArrEncoded}}:
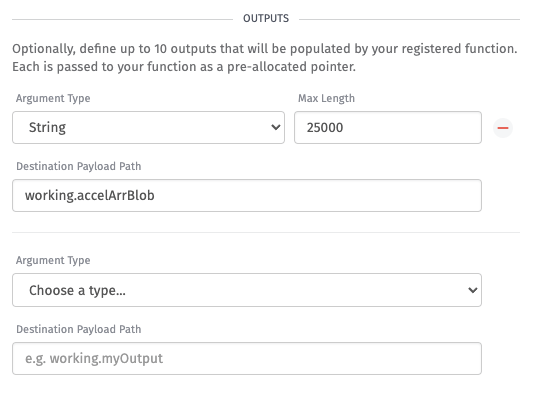
Then, the registered function has a single output of a string with a max length of 25000, which is placed on the payload at the path working.accelArrBlob:
The next JSON: Encode and Registered Function Nodes do the same thing, but with different payload paths. The JSON Encode Node’s source object is working.fftResults and it places the result on the payload at the path working.fftResultsEncoded. Then the Registered Function Node has the same configuration as the previous base64_encode registered function configuration, but with the following changes:
- The input string is the template
{{working.fftResultsEncoded}}, and - The output string is placed at the payload path
working.fftBlob. The Max Length for this Registered Function remains25000.
Lastly, a Device: State Node was added so that the state of this device can be saved for use on Dashboards and Application Workflows. Here’s the Device: State Node configuration:
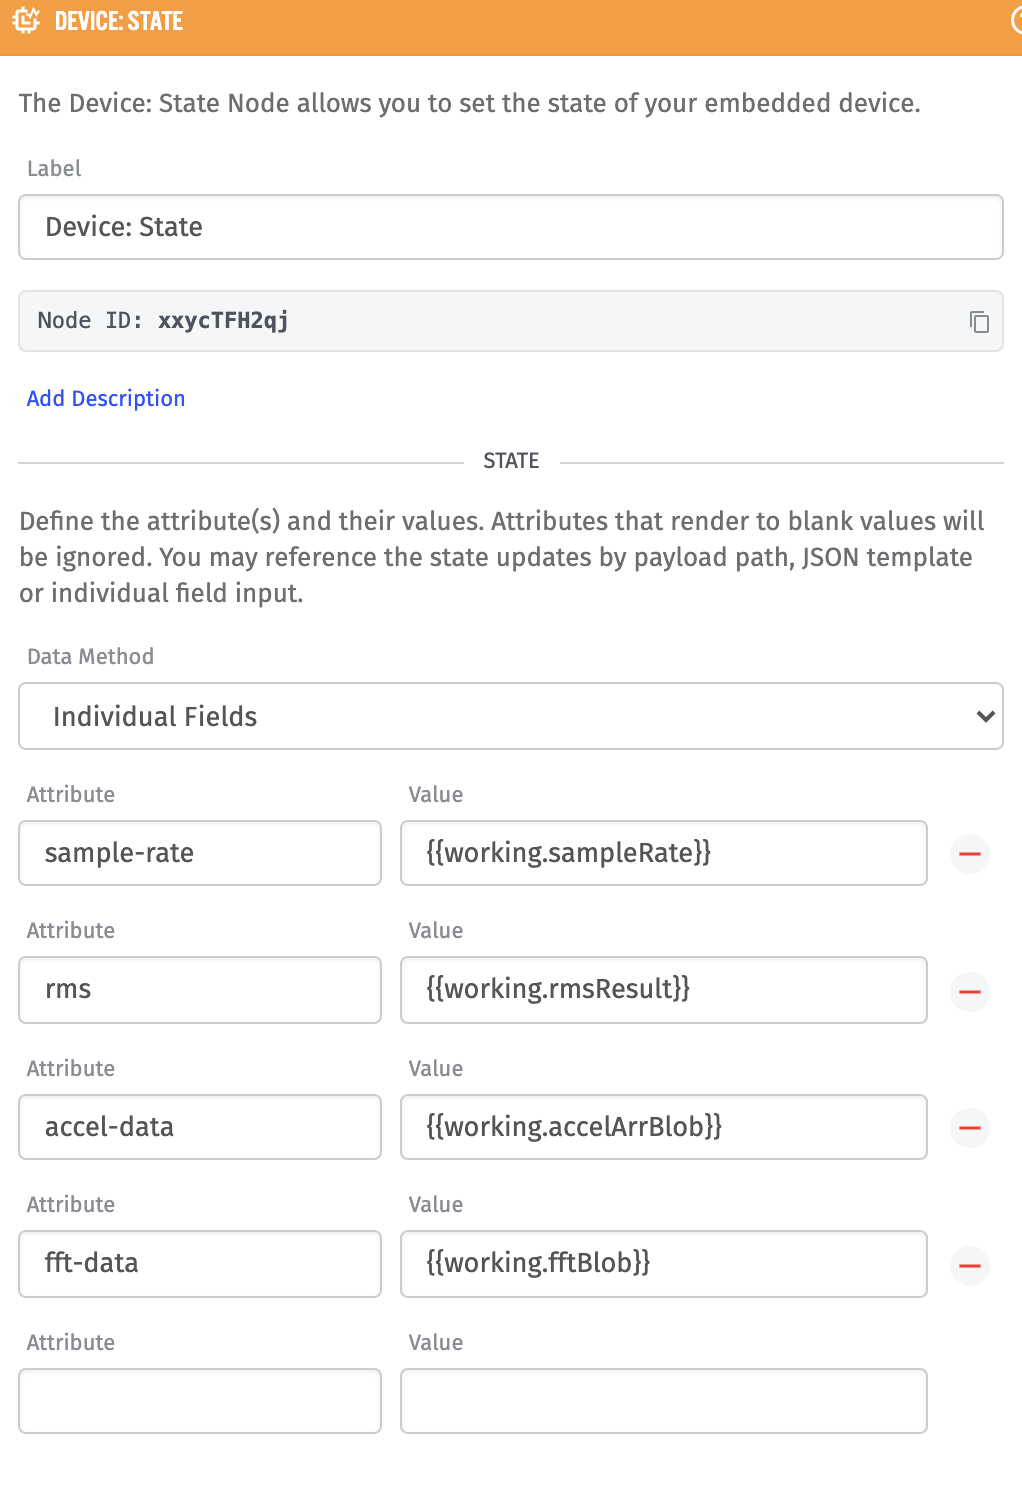
The device you created Step 3 has four (4) attributes and each attribute has a value that is on the payload:
sample-rateis{{working.sampleRate}}, a template referencing an output of theread_accelerometerregistered function.rmsis{{working.rmsResult}}, a template referencing the output of the Root Mean Square Node.accel-datais{{working.accelArrBlob}}, a template referencing the Base64 encoded array of acceleration data taken in theread_accelerometerregistered function.ftt-datais{{working.fftBlob}}, a template referencing the Base64 encoded array of FFT data that is output by the Fast Fourier Transform Node.
Once you save and deploy this workflow, you should see a trace output that a new bundle was received (just like in Step 4), and in the embedded device’s communication log, you can see the in coming states being reported.
Now you’re ready to start visualizing this data with Losant’s Dashboards and serving up Experiences to your users so they can see this data as well.
Step 7: Visualize FFT Data with a Losant Dashboard
On a new Dashboard, add a Custom HTML Chart block to your dashboard. We need a Custom HTML Chart instead of a Time Series Graph because the FFT data requires some processing on the data before we chart it. This is where the sample-rate attribute will come in handy.
We’ll add two queries to our Custom HTML Chart. The first for the FFT data:
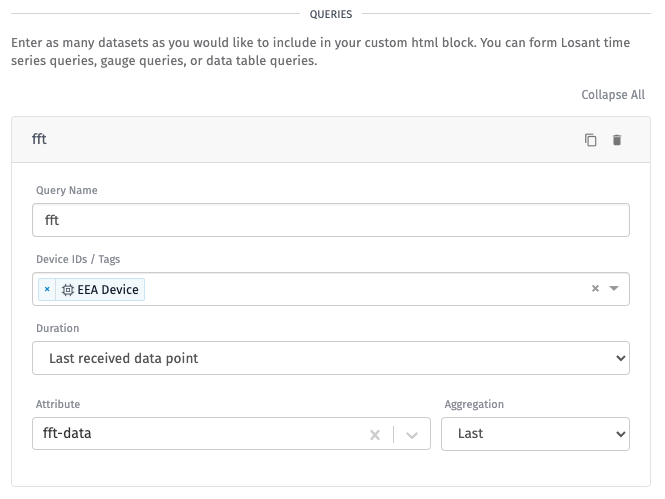
We named the query fft and have selected the embedded device that is reporting this data. The duration for this query is set to “Last received data point” and the attribute that is being queried is the fft-data attribute that we set up in Step 6 with the “Last” aggregation method selected.
The second query is for the sample rate attribute:
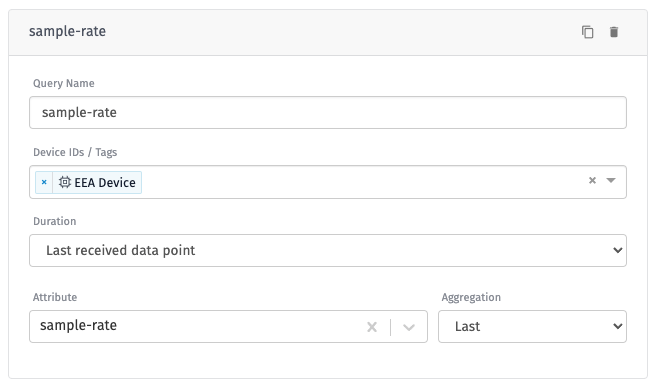
This query configuration is identical to the previous query for FFT data, but the query name is changed to sample-rate and the attribute we are querying is sample-rate.
You can find the code required for the Custom HTML Chart in the repository that you cloned in the directory Step-7-Visualize-FFT-Data-with-a-Losant-Dashboard. The Custom Header Content for the block is located in the file custom-header.html and the Custom Body Content is located in the file custom-body.html.
Once you have the Custom Header and Custom Body code in place, you may have to update the queries in the Custom Header code to reference the names of the queries you created.
For example, if you named the fft query differently, then here is where you would update that name:
var getData = function() {
    console.log(DashboardBlock.input.queries)
    if (!DashboardBlock.input.queries.fft) return
    fetch(
        DashboardBlock.input.queries.fft.value)
        .then(response => response.json())
        .then(data => drawGraph(data))
    }
So, instead of DashboardBlock.input.queries.fft you would use Dashboardblock.input.queries.<name-of-query>. The same applies for the sample-rate query.
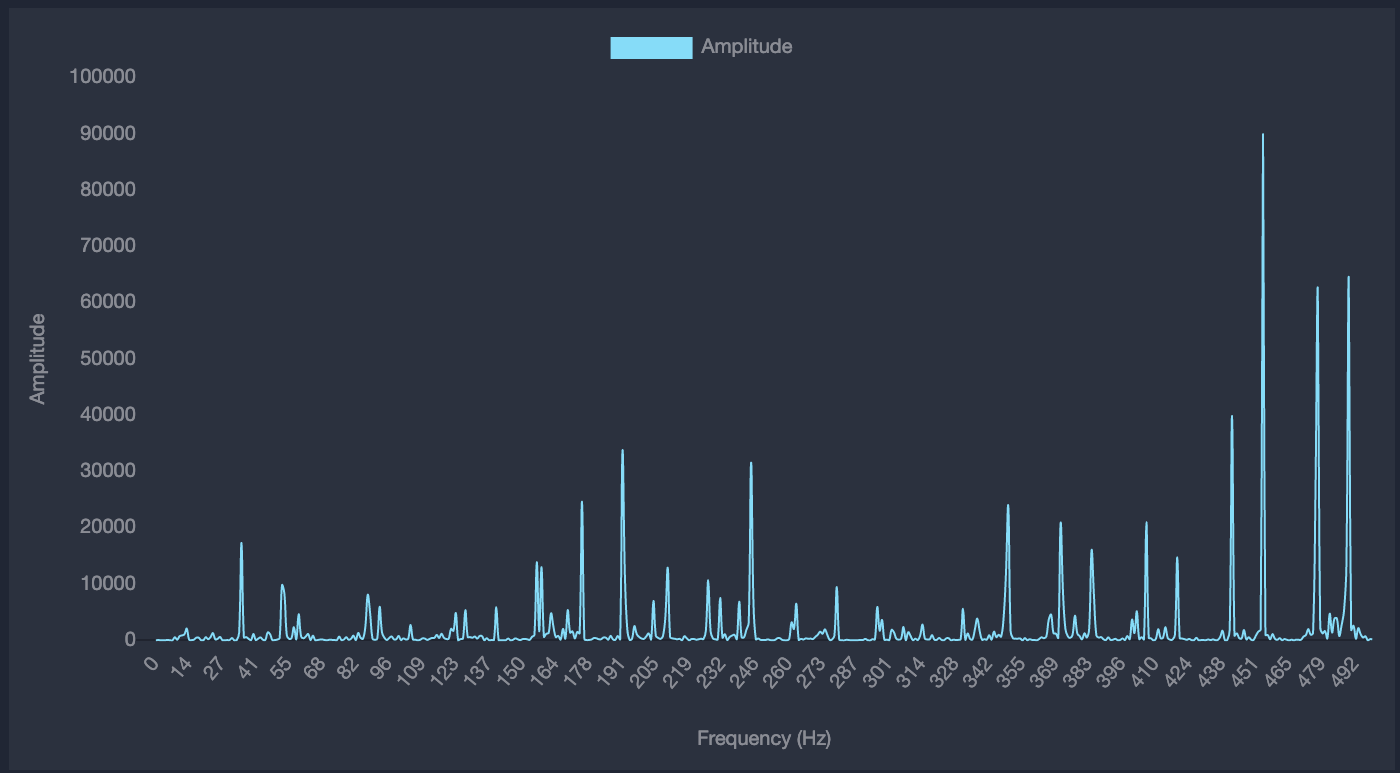
Then, after saving the block, your chart should look something like this (depending on what frequency your accelerometer is vibrating):
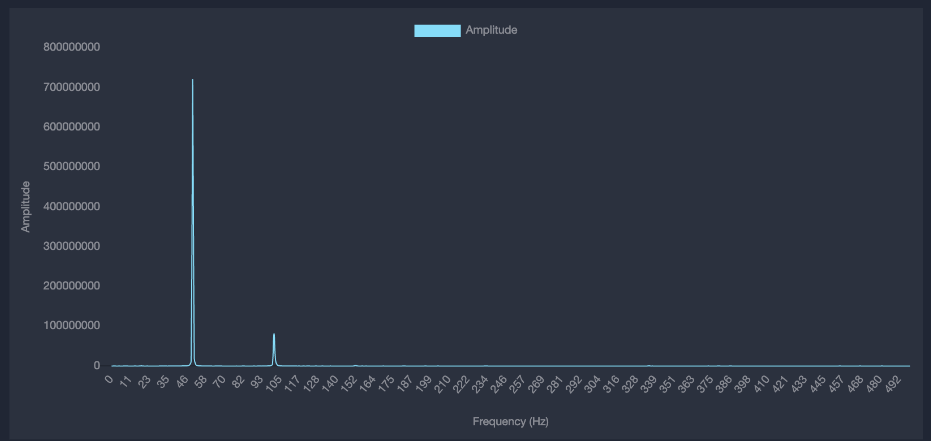
For example, an accelerometer attached to a pump produces this result:
Now that you have an Embedded Edge Agent working, you can change the functionality of your code over the air. All you have to do is make changes to a workflow (or create a new workflow) and deploy that workflow to your connect EEA device. Reminder: If you add more registered functions, you will need to add those to your firmware.
For questions related to EEA, how it works, and its implementation, please visit our forums.
Resources
Was this page helpful?
Still looking for help? You can also search the Losant Forums or submit your question there.